. 2020 Apr 17;12(1):e12025. doi: 10.1002/dad2.12025
© 2020 The Authors. Alzheimer's & Dementia: Diagnosis, Assessment & Disease Monitoring published by Wiley Periodicals, Inc. on behalf of the Alzheimer's Association.
This is an open access article under the terms of the http://creativecommons.org/licenses/by-nc/4.0/ License, which permits use, distribution and reproduction in any medium, provided the original work is properly cited and is not used for commercial purposes.
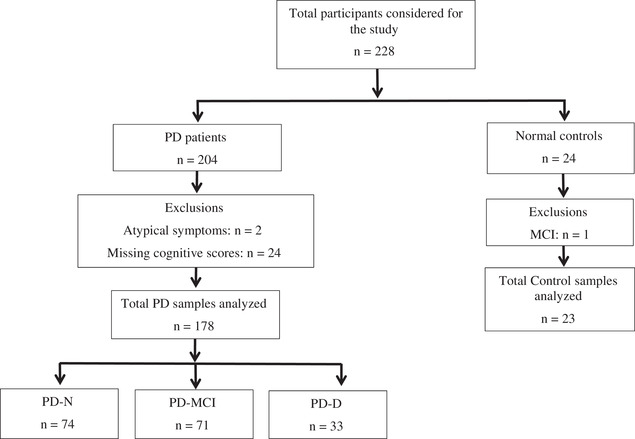
FIGURE 1.

Shows the study population
