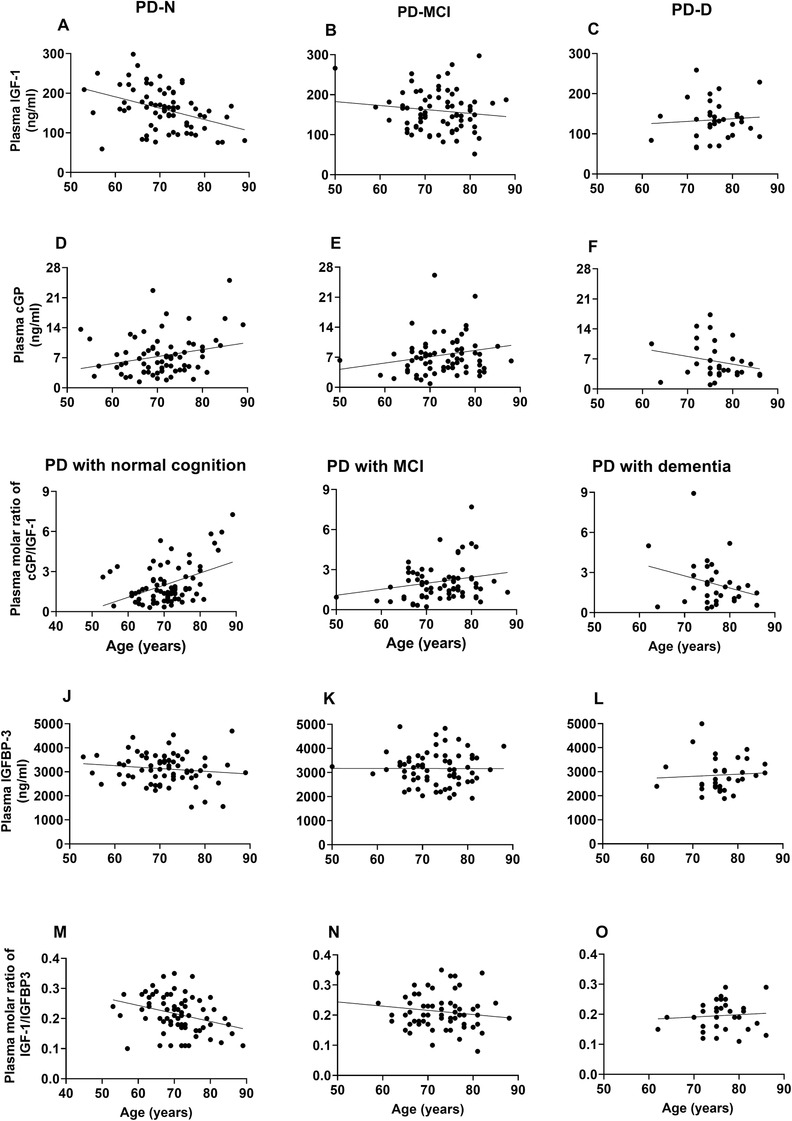
FIGURE 2.

Compares the age effects on the concentrations of IGF‐1 (A‐C), cGP (D‐F), and IGFBP‐3 (J‐L); and cGP/IGF‐1 molar ratio (G‐I) and IGF‐1/IGFBP‐3 molar ratio (M‐O) between the PD‐N, PD‐MCI, and PD‐D groups. The IGF‐1 concentration and IGF‐1/IGFBP‐3 molar ratio were negatively associated with age, whereas the cGP concentration and cGP/IGF‐1 molar ratio were positively associated with age in the PD‐N group. Compared to the changes in the PD‐N group, the biological measures were differently associated with age in the PD‐MCI and PD‐D groups, with strong interactions between the PD groups
