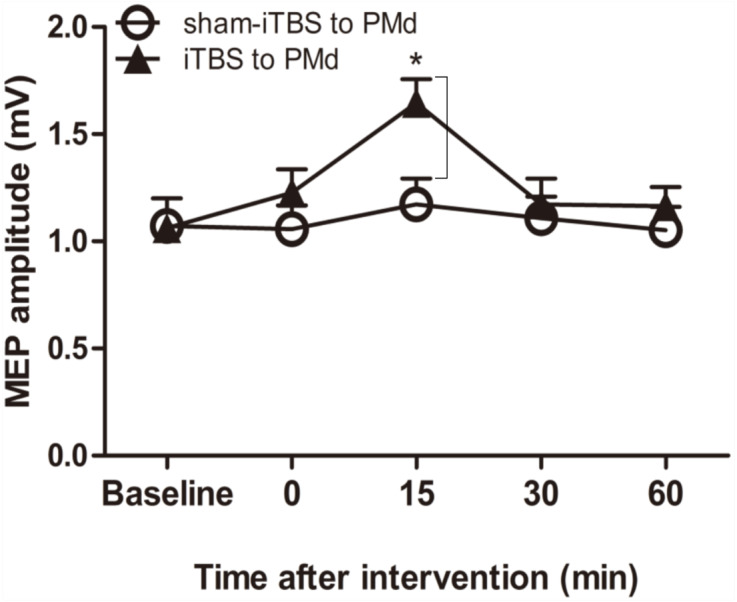
Figure 2. Effect of intermittent theta burst stimulation (iTBS)-induced dorsal premotor cortex (PMd) on primary motor cortex (M1) excitability.

MEP amplitudes were measured peak to peak. Circles indicate means and standard errors of the MEP amplitudes before and after sham-iTBS600 applied to the PMd interventional protocol. Black triangles indicate means and standard errors of the MEP amplitudes before and after iTBS600 applied to the PMd interventional protocol. *p < 0.05 compared with sham-iTBS.
