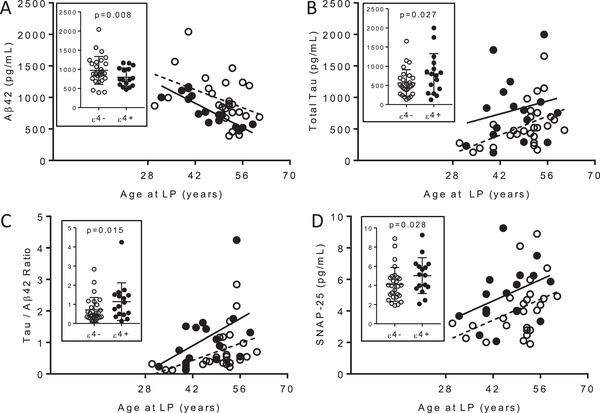
FIGURE 3.

Distribution of CSF biomarkers by age and APOE ε4 carrier status. Levels of (A) Aβ42, (B) total tau, (C) the tau/Aβ42 ratio, and (D) SNAP‐25 are plotted as a function of age at LP. Open circles and dotted lines represent APOE ε4 non‐carriers (ε4‐). Black circles and solid lines represent APOE ε4 carriers (ε4+). Lines are linear regressions of biomarker data by age at LP. One individual did not have APOE genotype data and was excluded from this analysis. Group comparisons were performed by ANCOVA with age as a covariate. Adjusted P values <.05 were considered statistically significant
