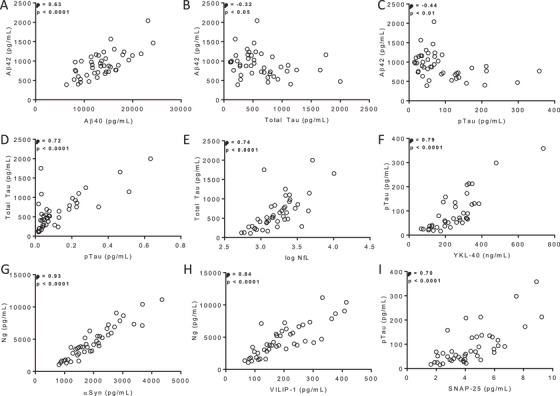
FIGURE 4.

Scatter plots of select biomarker correlations. Plotted are the relationships between levels of (A) Aβ42 and Aβ40, (B) Aβ42 and total tau, (C) Aβ42 and p‐tau, (D) total tau and p‐tau, (E) total tau and log NfL, (F) p‐tau and YKL‐40, (G) Ng and αSyn, (H) Ng and VILIP‐1, and (I) p‐tau and SNAP‐25. Correlation coefficients represent Spearman rho (ρ). P values <.05 were considered statistically significant.
