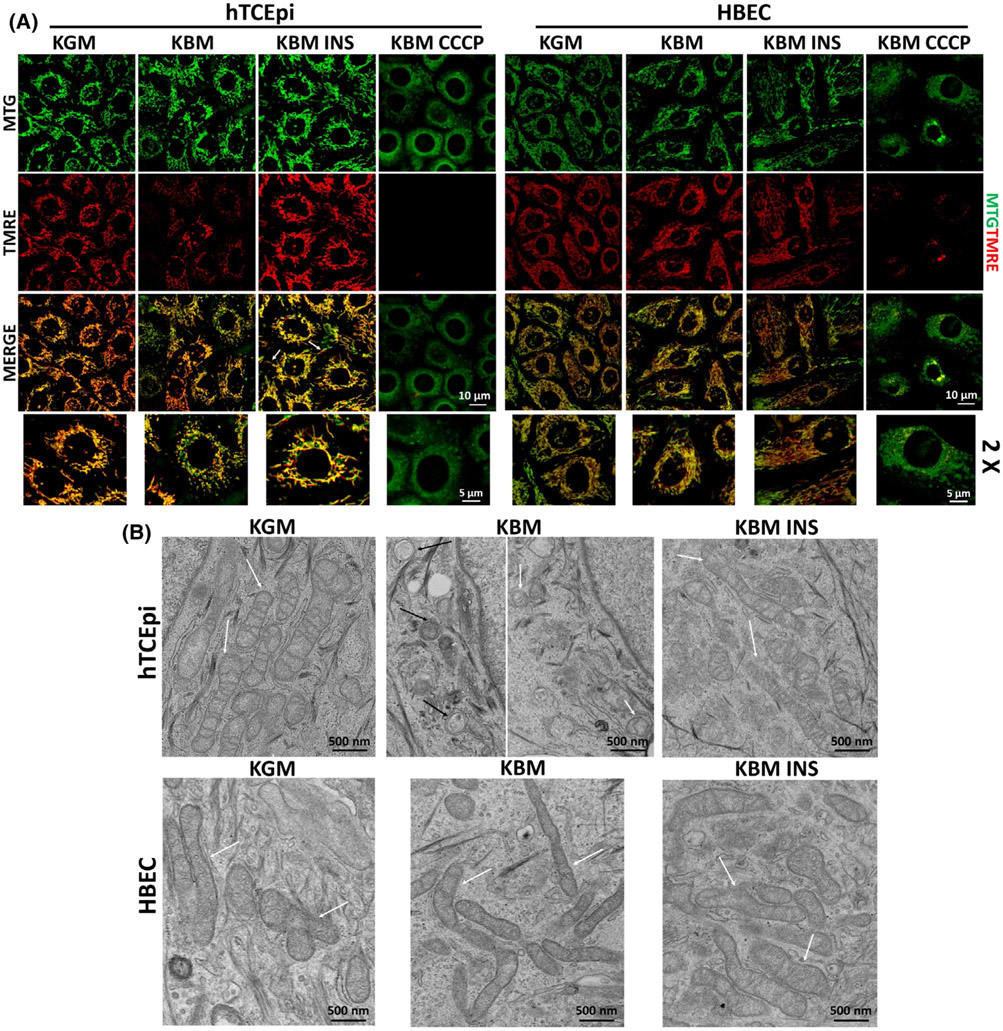
FIGURE 2.
Insulin selectively mediates mitochondrial polarization and mitochondrial protein distribution in hTCEpi cells. hTCEpi cells and HBECs were cultured in growth media (KGM), basal media (KBM), and KBM containing 5 μg/mL of human recombinant insulin (KBM INS) for 48 hours. A, MTG (green) and TMRE (red) were used to analyze mitochondrial morphology and polarization. In hTCEpi cells, polarization was decreased in KBM. Co-treatment with insulin blocked depolarization and triggered hyperpolarization, when compared to culture in growth conditions. Elongated mitochondria (white arrows) were visible. HBECs did not display any change in mitochondrial polarization or morphology in any of the treatments tested. CCCP was used as control for depolarization. Scale bar: 10 μm; zoomed images: 5 μm. B, TEM was used to analyze changes in mitochondrial morphology in hTCEpi cells (top row) and HBECs (bottom row). White arrows indicate mitochondria; black arrows indicate autophagic structures). Scale bar: 500 nm. n = 3

