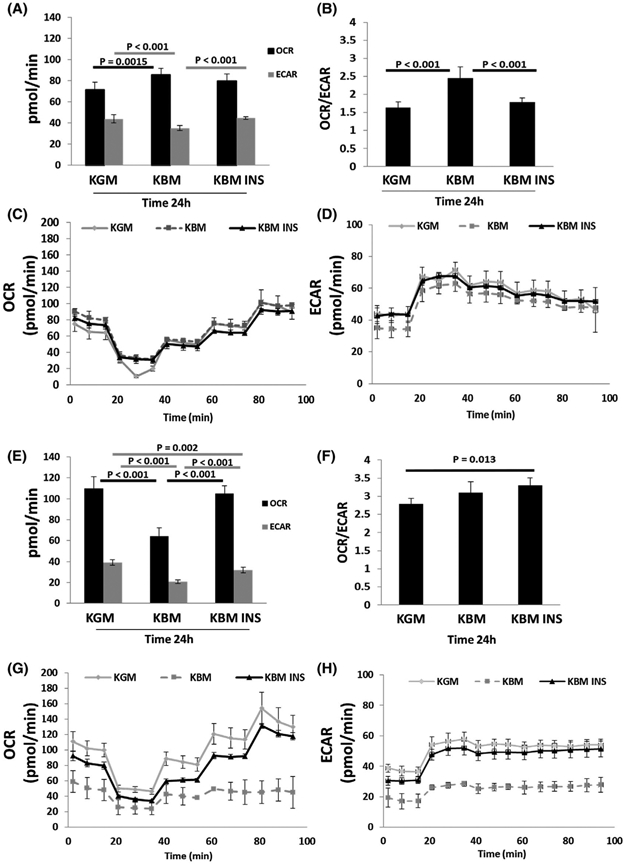
FIGURE 4.

hTCEpi cells increase their respiratory phenotype in the first 24 hours in basal media. hTCEpi cells and HBECs were cultured in growth media (KGM), basal media (KBM), and KBM with 5 μg/mL of human recombinant insulin (KBM INS) for 24 hours. A, Basal OCR and ECAR in hTCEpi cells. Culture in KBM decreased ECAR. This was accompanied by a compensatory increase in OCR. Insulin blocked the changes in KBM. B, The OCR/ECAR ratio in hTCEpi cells was increased in KBM, indicating a shift toward a higher respiratory phenotype. This was blocked by insulin. C, OCR plotted as a function of time in hTCEpi cells. D, ECAR plotted as a function of time in hTCEpi cells. E, Basal OCR and ECAR in HBECs. OCR and ECAR were both decreased in KBM and increased with insulin. F, In HBECs, there was no change in the metabolic phenotype in KBM, but there was a significant increase toward a respiratory phenotype when treated with insulin. G, OCR plotted as a function of time in HBECs. H, ECAR plotted as a function of time in HBECs. Data shown as mean ± standard deviation from one representative experiment. One-way ANOVA, Holm-Sidak multiple comparisons test. n = 3
