FIGURE 7.

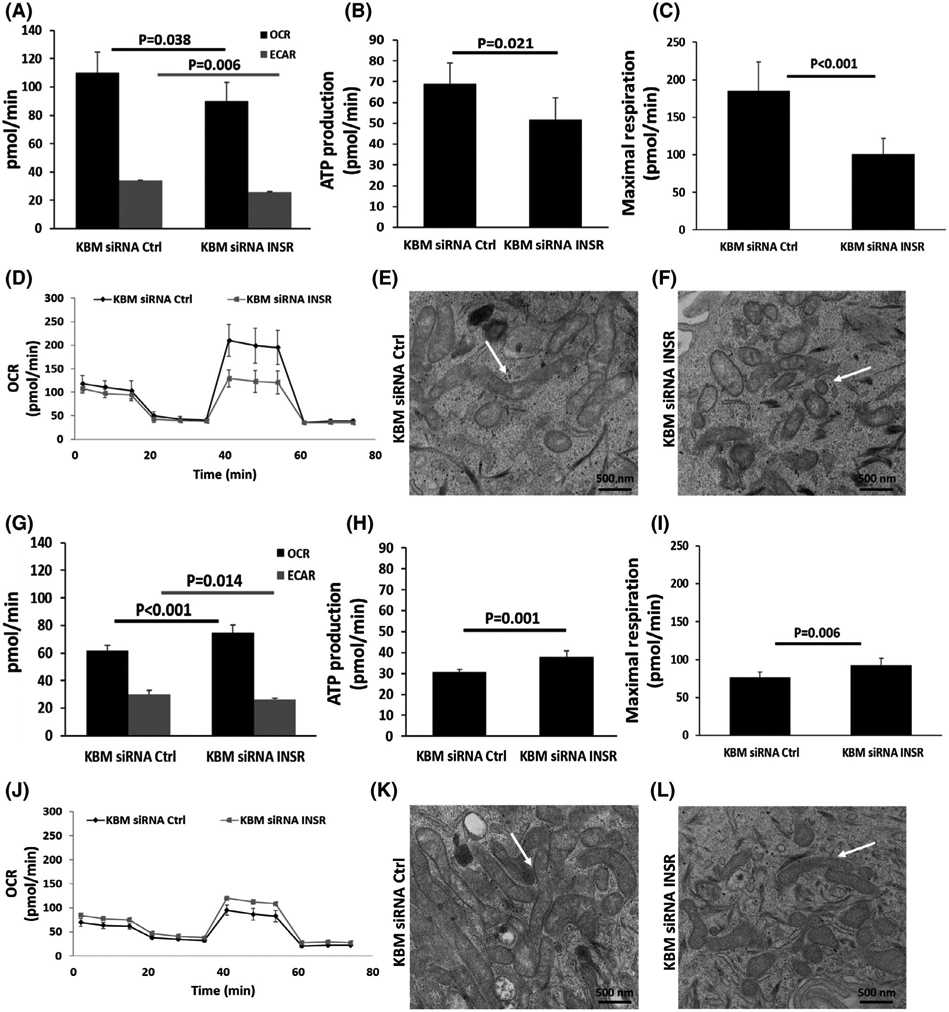
INSR regulates mitochondrial function in hTCEpi cells. hTCEpi cells and HBECs were treated with siRNA oligonucleotides targeting INSR in basal media for 24 hours. A-D, In hTCEpi cells, (A) OCR and ECAR were decreased in KBM after INSR knockdown. B, ATP production per minute was decreased, and (C) the maximal respiratory capacity was also decreased. D, Representative line graph of OCR over time. E,F, TEM showing changes in mitochondrial morphology after INSR knockdown in hTCEpi cells cultured in KBM. E, Healthy mitochondria are visible in controls cells transfected with siRNA non-targeting oligonucleotides (white arrow); F, altered mitochondrial morphology in cells after knockdown of INSR. Scale bar: 500 nm. G-J, In HBECs, (G) OCR increased and ECAR decreased in KBM after INSR knockdown. H, ATP production per minute was increased, as was the (I) maximal respiratory capacity. J, Representative line plot of OCR as a function of time. K,L, TEM showing mitochondrial structure in HBECs. K, Healthy mitochondria were visible after transfection with the control siRNA oligonucleotide. L, Morphological changes were evident in mitochondria after INSR knockdown. Despite obvious mitochondrial thinning, mitochondria remained elongated and functional. Data represented as mean ± standard deviation from one representative experiment, t-test. n = 3
