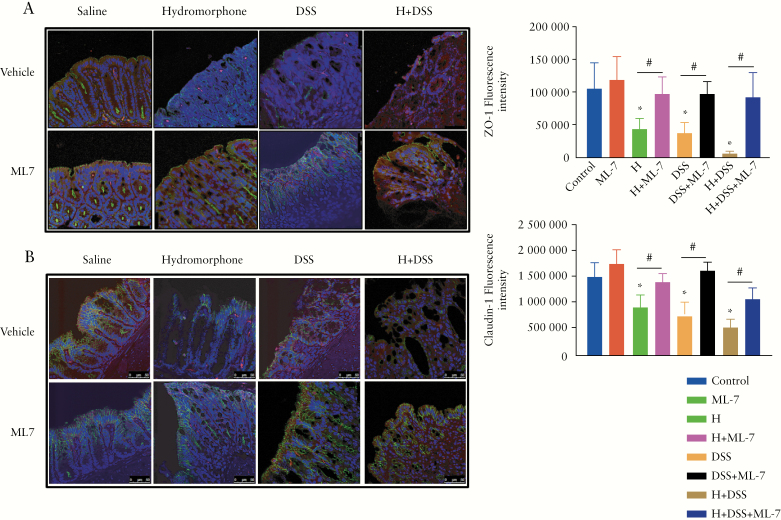
Figure 8.
Hydromorphone modulates intestinal tight junction proteins organisation in an MLCK-dependent manner. [A] Representative images of ZO-1 and [B] Claudin-1 organisation in colon sections and quantitative measurement of green fluorescence intensity [n = 5 per group] using ImageJ software. Images were analysed by confocal scanning microscope. Scale bar: 50 μm [original magnification: x 40]. Analysis was done as described in materials and methods. Mean ± SEM, 95% CI. Asterisk [*] indicates statistical significance [p <0.05] vs control group and hash sign [#] indicates statistical significance [p <0.05] between treatment groups by ANOVA followed by Tukey’s multiple comparisons test. MLCK, myosin light chain kinase; SEM, standard error of the mean; CI, confidence interval; ANOVA, analysis of variance.

