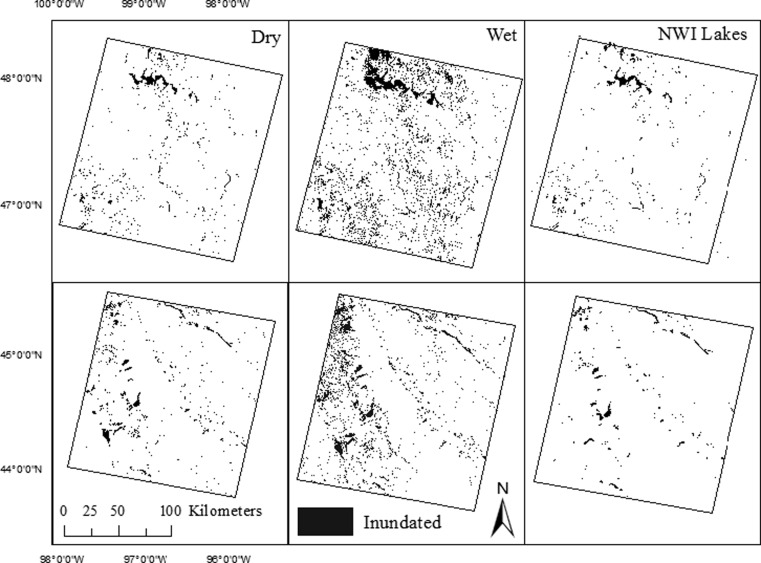
Fig. 4.
Patterns of inundation for dry, or Pr(0.06) cumulative distribution function (CDF) of the Palmer Hydrological Drought Index (PHDI) (spring 1990) (left) and wet, or Pr(0.99) CDF PHDI (spring 2011) (middle) conditions for p31/r27 (top row) and p29/r29 (bottom row). Lake extent as defined by the National Wetland Inventory (NWI) dataset (right). NOTE: Not all wetlands are visible due to the scale of the images

