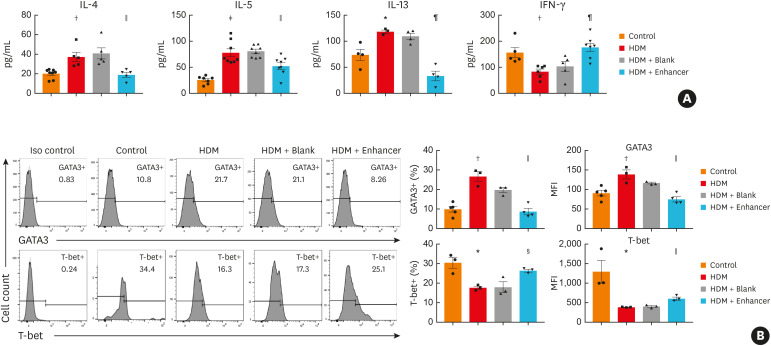
Fig. 4. MiR-1165-3p repressed Th2 cell function in vivo. (A) The concentrations of different cytokines in bronchoalveolar lavage fluid were measured with enzyme-linked immunosorbent assay. (B) The percentages and MFI of GATA3+ or T-bet+ cells in CD4+ cells from the spleen were determined by flow cytometry (n = 3–8).
IL, interleukin; IFN, interferon; miR-1165-3p, microRNA-1165-3p; HDM, house dust mite; MFI, mean fluorescence intensity.
*P < 0.05, †P < 0.01, ‡P < 0.001, HDM vs. control group; §P < 0.05, ‖P < 0.01, ¶P < 0.001, HDM+ enhancer vs. HDM + blank group.

