
Figure 5.
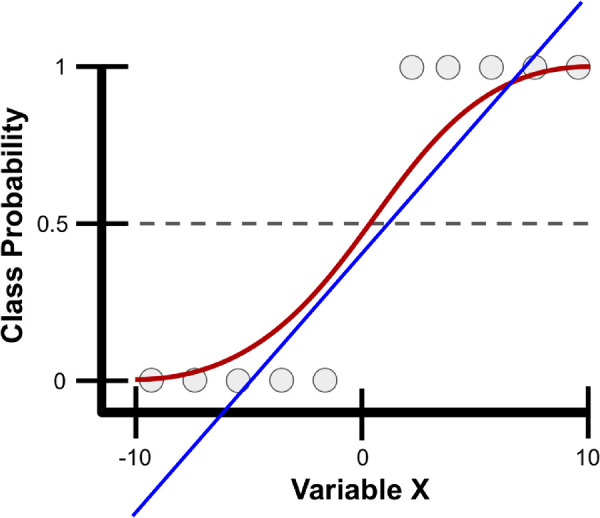
Example class probability prediction using linear and logistic regression. Presented are linear (blue line) and logistic (red line) regression models for predicting the probability of various samples (gray circles) as belonging to a particular class using a single variable, variable X, which ranges from -10 to 10. With logistic regression, variable X is transformed into class probabilities that are bounded between 0 and 1 using the sigmoid function. Simple linear regression attempts to estimate class probabilities, but is not bounded between 0 and 1; thus, it breaks a fundamental law of probability that does not allow for negative probabilities or those greater than 1.