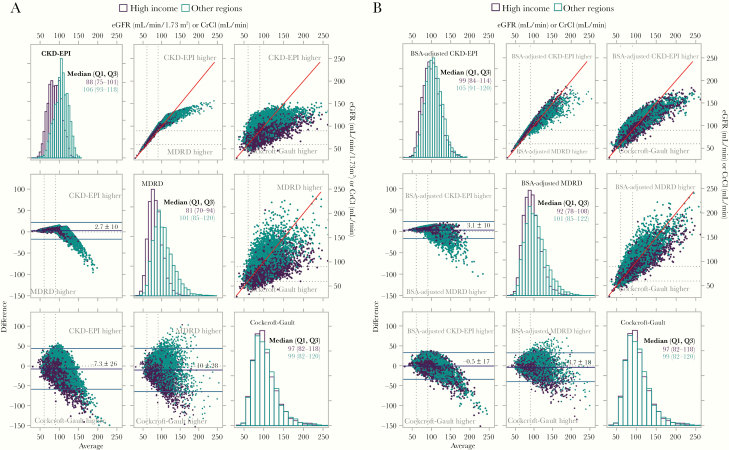
Figure 2.
Histograms, Bland-Altman plots and scatterplots for 3 kidney function equations by Global Burden of Disease (GBD) super-regions (high-income versus other regions). A, Data presented without body surface area (BSA) adjustment for Chronic Kidney Disease Epidemiology Collaboration (CKD-EPI) and Modification of Diet in Renal Disease (MDRD) equations. Estimated glomerular filtration rate (eGFR) distributions by each equation are presented in histograms on the diagonal. Data from high-income regions is represented by purple, and data from other GBD regions in teal. Panel 1 (top row left) for CKD-EPI: median eGFR, 88 and 106 mL/min/1.73 m2 for high-income and other GBD regions, respectively. Panel 5 (middle row center) for MDRD: median eGFR 81 and 101 mL/min/1.73 m2 for high-income and other GBD regions, respectively. Panel 9 (bottom row right) for Cockcroft-Gault: median creatinine clearance (CrCl) 97 and 99 mL/min for high-income and other GBD regions, respectively. Pairwise Bland-Altman plots below the diagonal present plots of the average of the 2 equations on the x-axis versus the difference of the 2 equations on the y-axis. Panel 4 (middle row left) presents MDRD versus CKD-EPI equation with the CKD-EPI yielding an overall average 2.7 units higher, with notably higher values for the MDRD equation for persons with eGFR > 120 mL/min/1.73 m2. Panel 7 (bottom row left) presents Cockcroft-Gault versus CKD-EPI equation with the Cockcroft-Gault yielding an overall average 7.3 units higher, with notable variation between the 2 equations for any given value. Panel 8 (bottom row center) presents Cockcroft-Gault versus MDRD equation with the Cockcroft-Gault yielding an overall average 10 units higher, with notable variation between the 2 equations for any given value which is more pronounced at higher values. Simple scatterplots are presented in panels 2 (top row center) (MDRD vs CKD-EPI), 3 (top row right) (Cockcroft-Gault vs CKD-EPI) and 6 (middle row right) (Cockcroft-Gault vs MDRD). These data confirm the findings in the Bland-Altman plots. B, Data presented with adjustment for individual BSA for CKD-EPI and MDRD equations, in the same format as in A. The discrepancy between the eGFR values for high-income and other GBD regions is partially attenuated by adjusting for BSA, with an increased eGFR estimate for high-income regions. The variation in values generated by the equations is decreased. This attenuation is best represented in the scatterplots presented in B, panels 2, 3, and 6.

