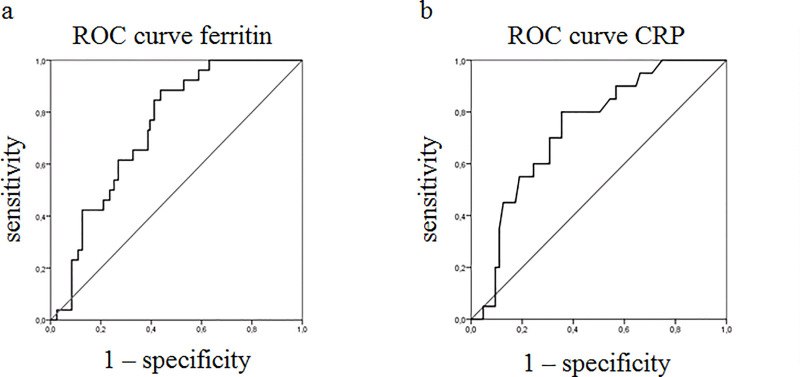
Fig 1. Receiver operating characteristic (ROC) curves.
a) ROC curve for ferritin and MAS. The area under the ROC curve resulted to be 0.739 (95% CI: 0.652–0.825, p = 0.0001); the analysis showed that the best cut-off for ferritin was 1225 ng/ml in predicting MAS, providing a sensitivity of 88% and a specificity of 57%. b) ROC curve for CRP and mortality. The area under the ROC curve resulted to be 0.735 (95% CI: 0.632–0.838, p = 0.001); the analysis showed that the best cut-off for CRP in predicting mortality was 68.7 mg/L, providing a sensitivity of 80% and a specificity of 65%.

