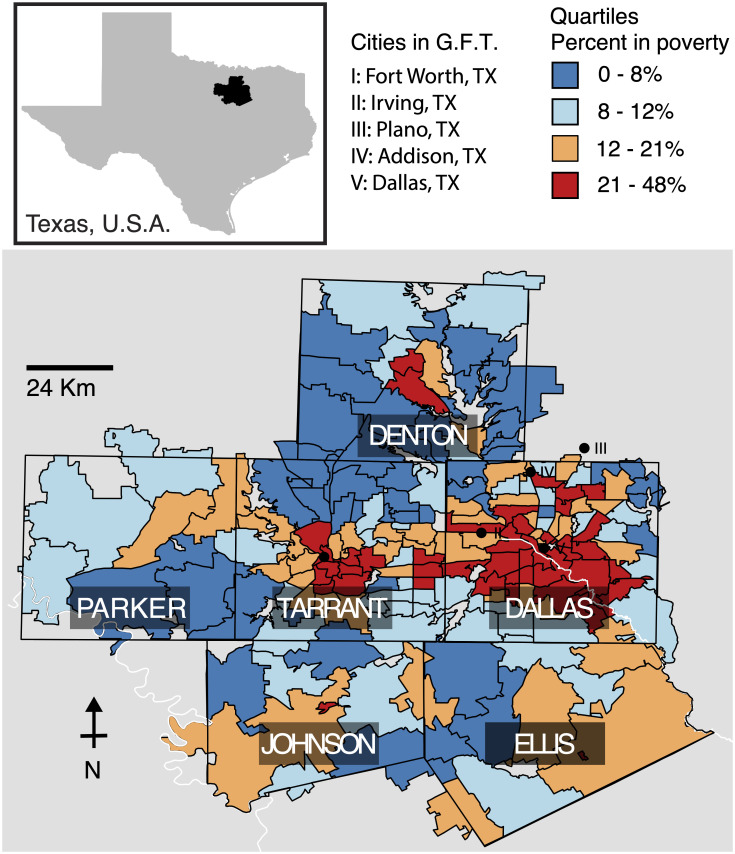
Fig 2. The six counties in northeast Texas included in this study (Dallas, Tarrant, Parker, Denton, Johnson, and Ellis).
Zip codes are colored by their poverty quartile, [0-8) (dark blue), [8-12) (light blue), [12-21) (orange), >21 (red) percent of residents below the poverty line. In addition to the state-level Google Flu Trends (GFT) time series, we used the five city-level time series most closely associated with our study area: Fort Worth (I), Irving (II), Plano (III), Addision (IV), and Dallas (V).

