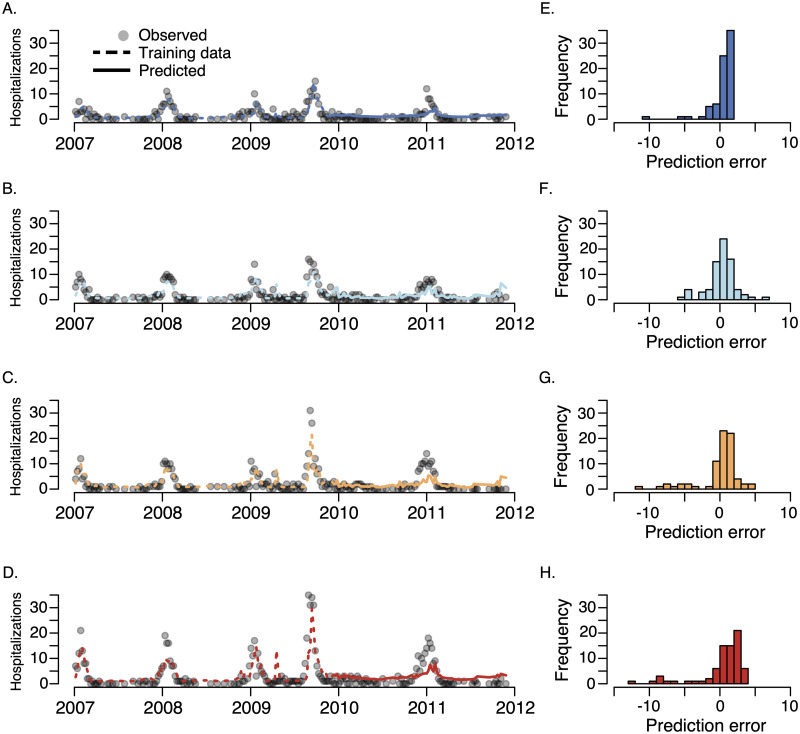
Fig 4. Comparison between one-week ahead model predictions and the total number of weekly observed influenza hospitalizations for each of the four poverty quartiles (A) upper quartile (i.e. least impoverished), (B) upper-middle quartile, (C) lower-middle quartile, (D) lowest quartile (most impoverished) and the distribution of out-of-sample prediction errors (observed—predicted) for the (E) upper quartile, (F) upper-middle quartile, (G) lower-middle quartile, and (H) lowest quartile.
The model was trained on the first 60% of the data (dashed lines) and evaluated on the remaining 40% of the data (solid lines). Qualitatively similar results were obtained with n-fold (leave-one-out) cross-validation, see Tables 2 and 3 and S2 Text. Across all four quartiles, the model was unbiased according to a re-sampling test on the residuals, see S3 Text.

