
Figure 3. Localized DNA breakage and rearrangement with bridge breakage.
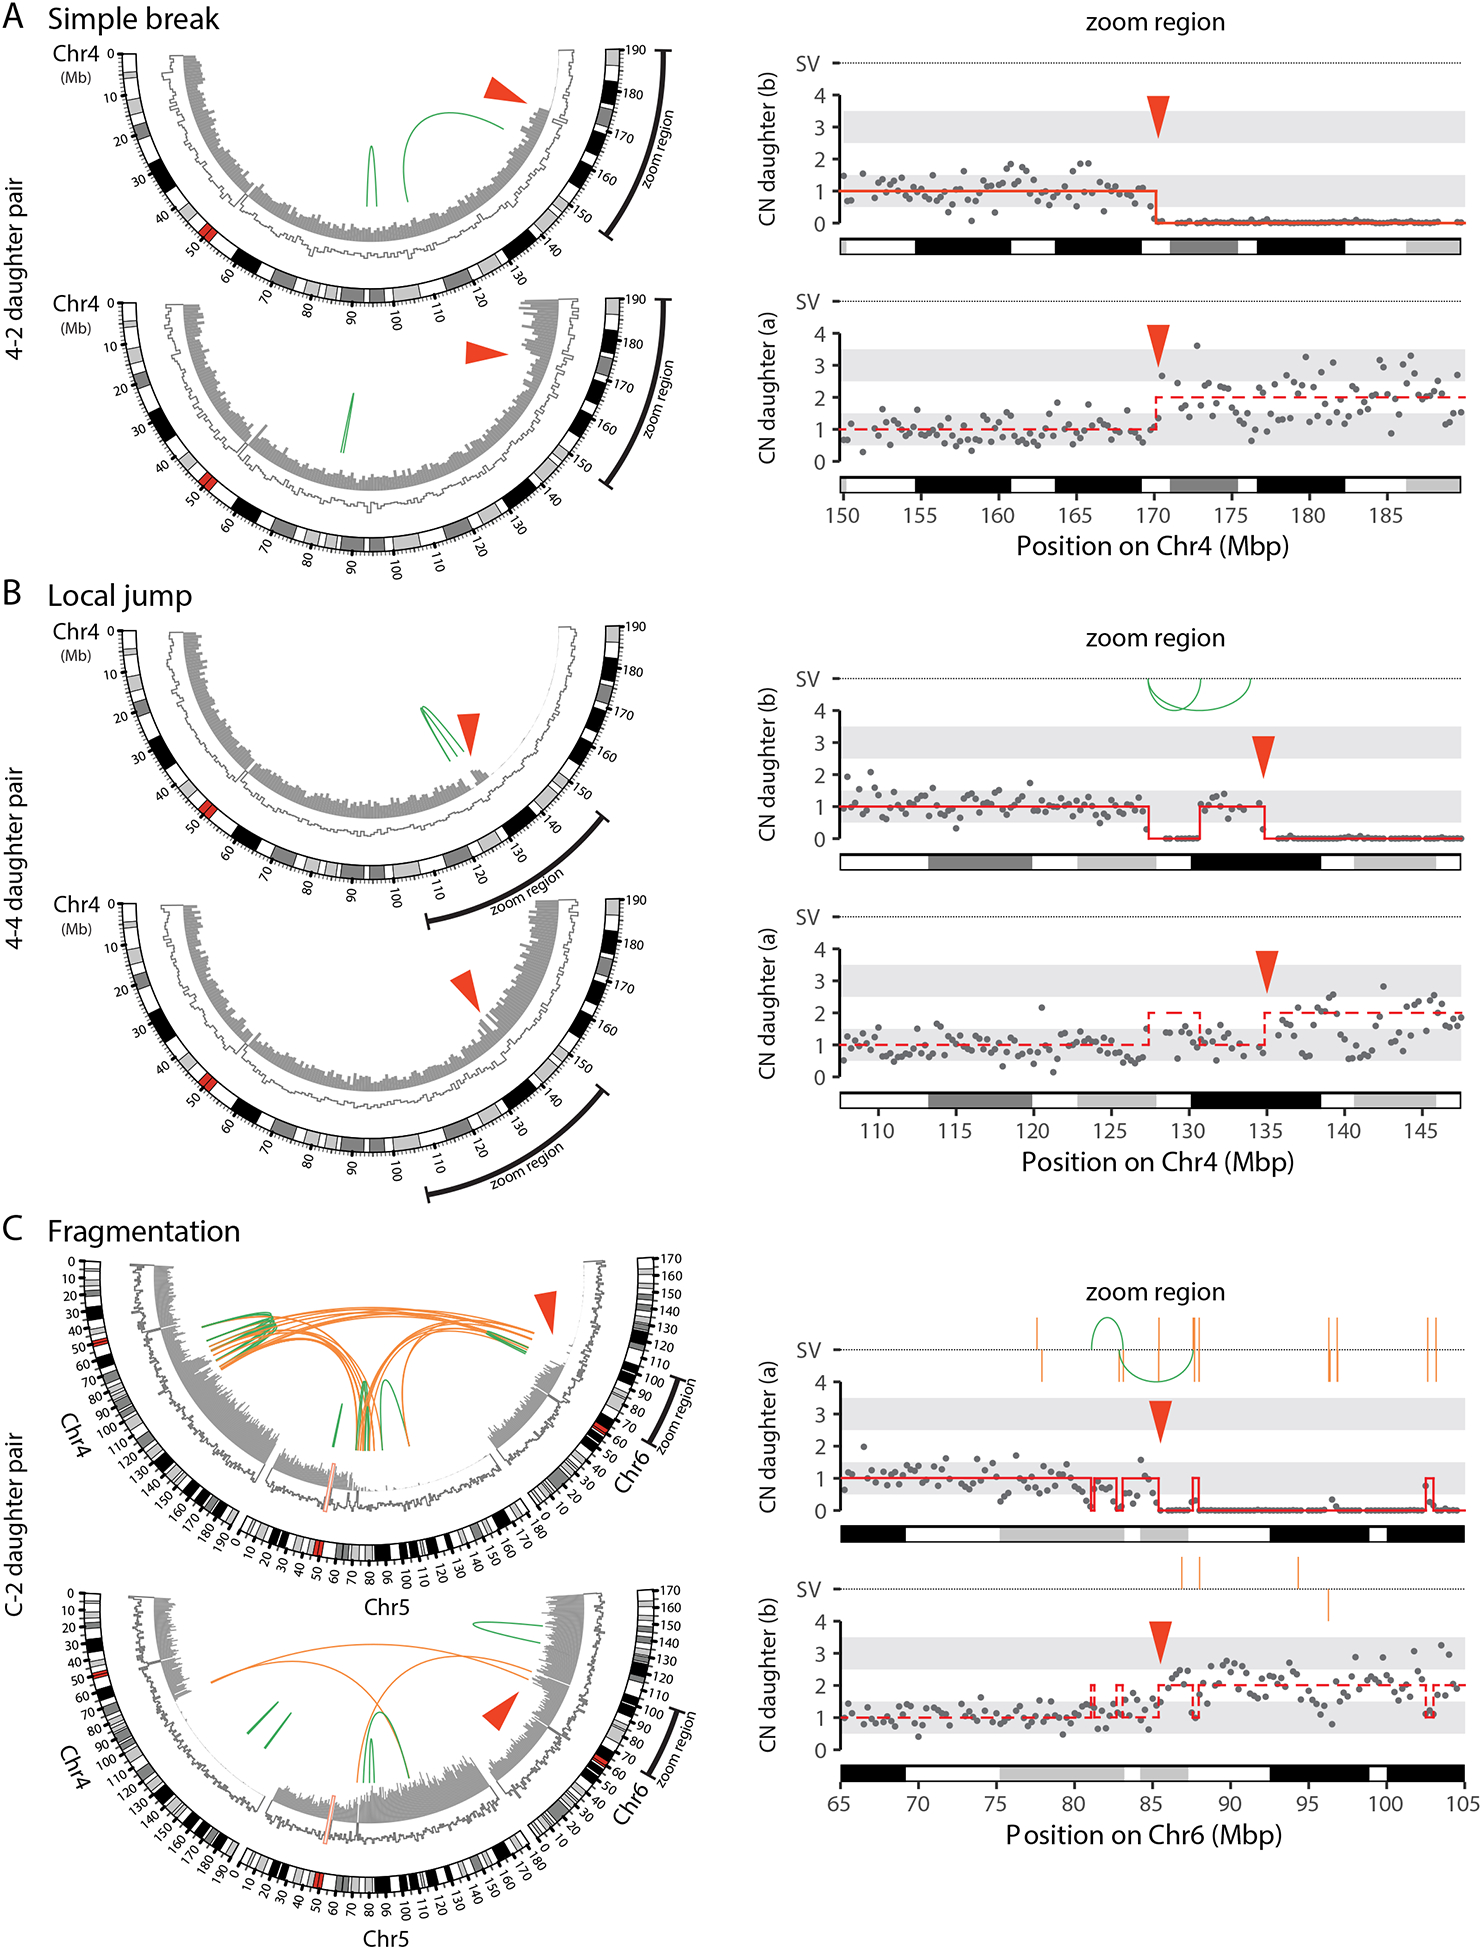
(A) Simple bridge breakage. Left: CIRCOS plots showing the bridge chromosome (Chr4). Outer arc: chromosome cytoband. Inner arcs: DNA copy number for the bridge haplotype (filled gray bars) and the non-bridge haplotype (white bars, gray outline). Green lines: intrachromosomal structural variants (SVs). Red arrowhead: bridge breakpoint. Right: Zoom-region plot shows copy number (gray dots: 250-kb bins) near the bridge breakpoint. Copy-number segments (red solid lines) were determined using SNP-level coverage in the top daughter (Supplemental Methods); the bottom daughter is inferred to contain reciprocal copy-number segments (dashed red lines). SVs, as in CIRCOS plots, are shown above.
(B) Bridge breakage can produce the “local jump” pattern. As in (A), CIRCOS plots (Left) and zoom-region plot (Right) for the bridge chromosome (Chr4).
(C) Local fragmentation and complex rearrangement with bridge breakage. As in (A), CIRCOS plots (Left) and zoom-region plot (Right) for a bridge containing three different chromosomes (Chr4, Chr5, and Chr6) showing local fragmentation. The pattern of rearrangements in daughter (b) indicates end-joining of these fragments, producing intra- and inter-chromosomal rearrangements (green and orange lines, respectively). Daughter (a) additionally evidences the TST jump rearrangement pattern (see Fig. 5).