
Figure 5. The Tandem Short Template (TST) jump rearrangement signature.
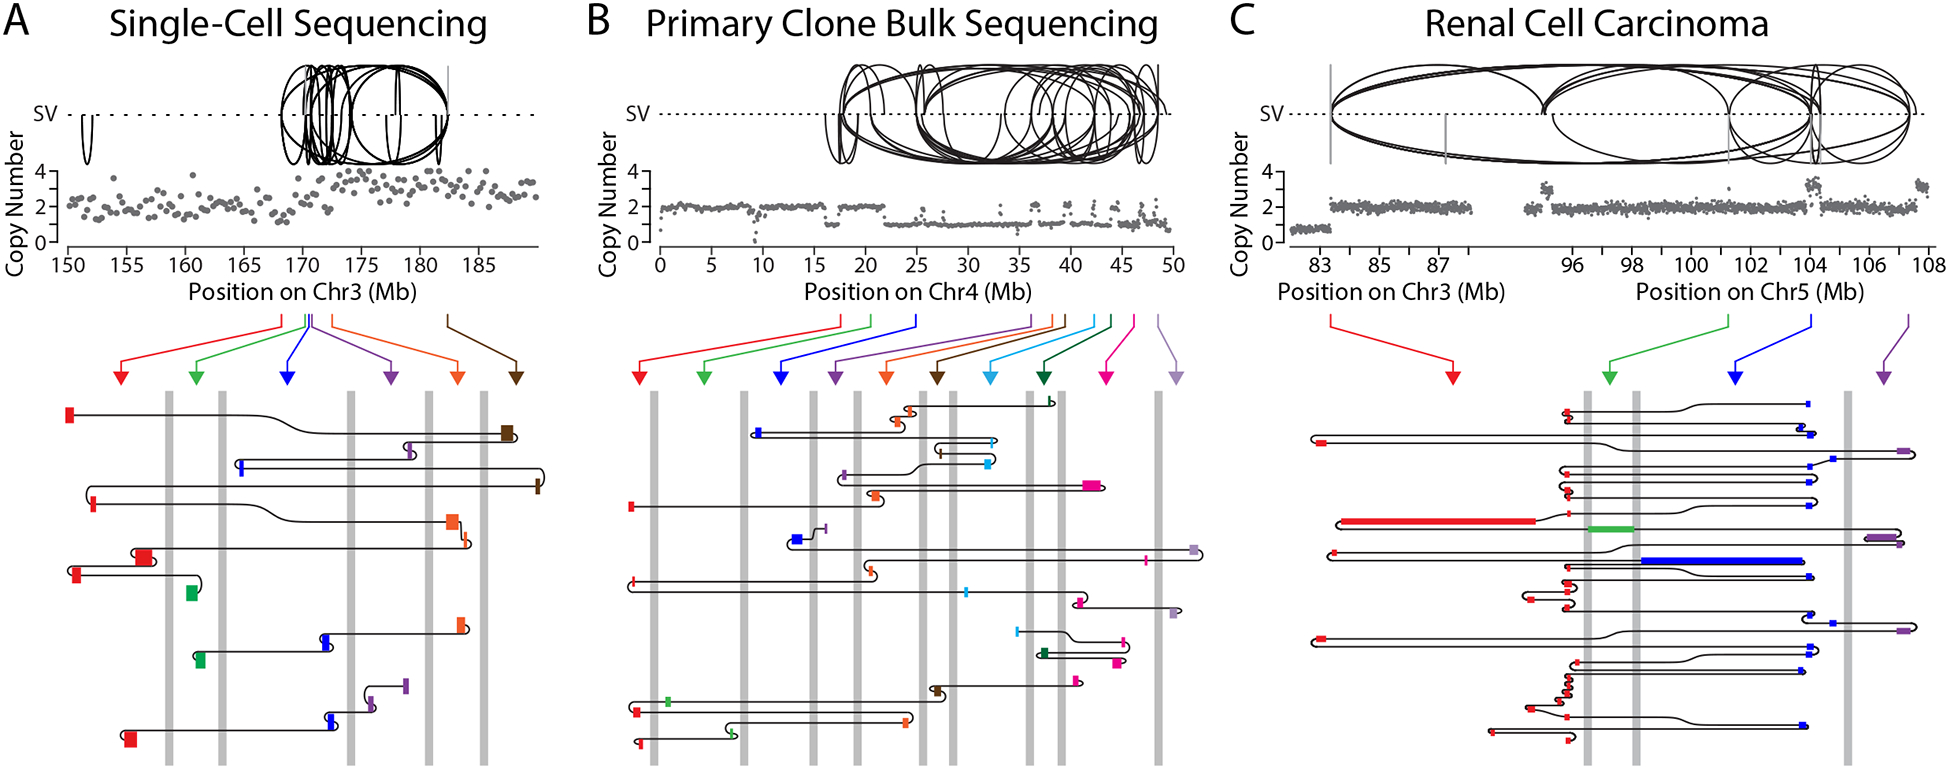
(A) Features of the TST jump signature. Top: plots show copy number (gray dots, 250-kb bins) and SVs (black: intrachromosomal; gray interchromosomal) for a region near the bridge breakpoint on Chr3. Bottom: schematic shows three chains of templated insertions (rectangles), colored according to their origin from six breakpoint hotspots (arrows from Top). Templated insertions are connected as shown by black lines, in a zoom-region view for each breakpoint hotspot (≤10-kb window in each region). Grey vertical lines are axis breaks indicating distances of >10 kb between the hotspots.
(B) The TST jump signature in bulk sequencing data from a primary clone after bridge breakage. As in (A), Top: copy number (250-kb bins) and SVs for the bridge chromosome (Chr4). Bottom: four chains of templated insertions originating from 10 breakpoint hotspots.
(C) TST jump signature in long-read sequencing from a renal cell carcinoma sample. As in (A), Top: copy number (10-kb bins) and SVs for the region of unbalanced translocation between Chr3 and Chr5. Bottom: one chain of templated insertions originating from four breakpoint hotspots (3- to 10-kb windows).