
Figure 7. Ongoing instability and subclonal heterogeneity after chromosome bridge formation.
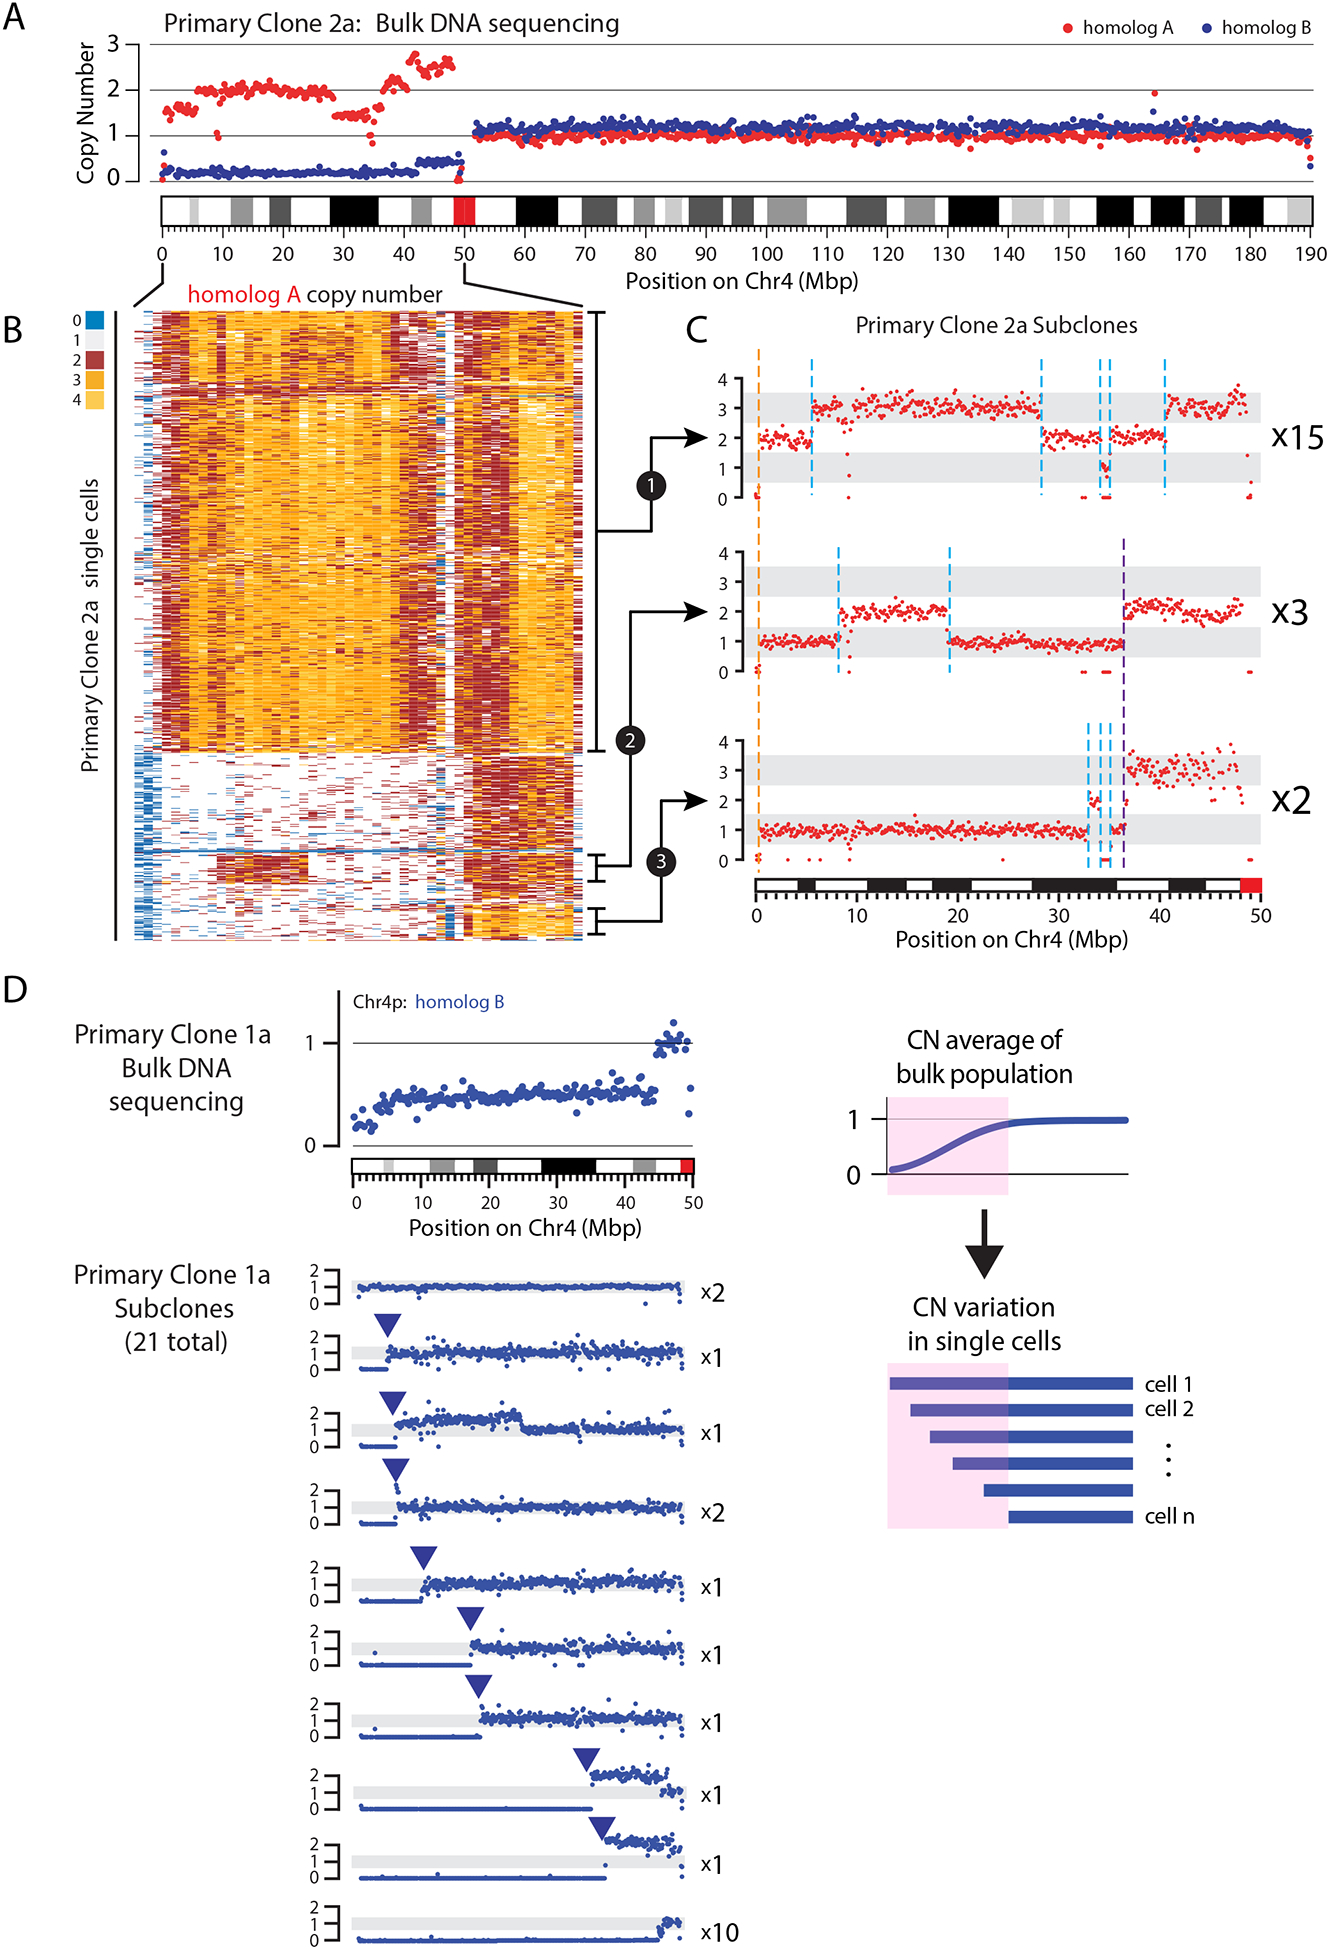
(A) Bulk sequencing indicates subclonal heterogeneity within a primary clone derived from a single cell after bridge breakage. Plot shows DNA copy number (CN) for the two Chr4 homologs (red and blue dots, 25-kb bins). Regions of non-integer CN indicate the existence of subclones with different CN states.
(B) CN heatmap for Chr4p (0–50 Mb) homolog A in 637 single cells. Each row represents one cell. Different subclonal populations can be identified that exhibit CN profiles consistent with those seen in single cell-derived subclones, shown in (C).
(C) CN profiles for Chr4p homolog A (red dots, 25-kb bins) in 20 subclones grown from single cells isolated from one primary clone. One CN transition (breakpoint) is shared by all subclones (dashed orange line) whereas other CN changes are shared only among a subset of subclones (dashed purple line), or are private to individual subclones (dashed cyan lines). The number of subclones represented in each CN profile is listed next to each plot.
(D) Detection of ongoing chromosomal instability in a primary clone. Left Top: CN for Chr4p homolog B from bulk sequencing of the primary clone. Left Bottom: 10 unique CN profiles identified from 21 single-cell derived subclones obtained from the primary clone. The number of subclones represented in each CN profile is listed next to each plot. Right: Schematic shows how gradual sloping copy number transitions in bulk populations are explained by subconal heterogeneity.