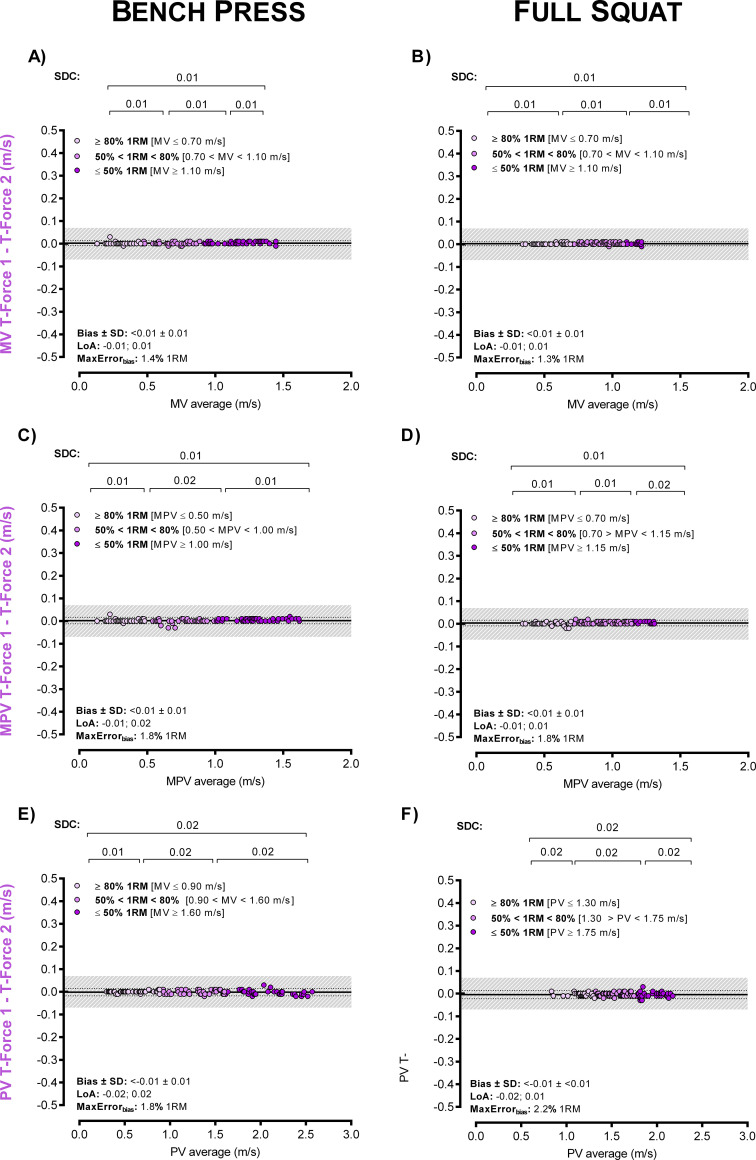
Fig 3. Intra-device agreement between two T-Force devices.
Bland–Altman plots for the velocity readings in bench press (A, C and E panels) and full squat (B, D and F) exercises. Panels are ordered by velocity outcomes: mean velocity (MV), mean propulsive velocity (MPV) and peak velocity (PV). The grey shaded area indicates an acceptable level of agreement between devices, which results in differences in terms of load ≤ 5% 1RM [26,27].

