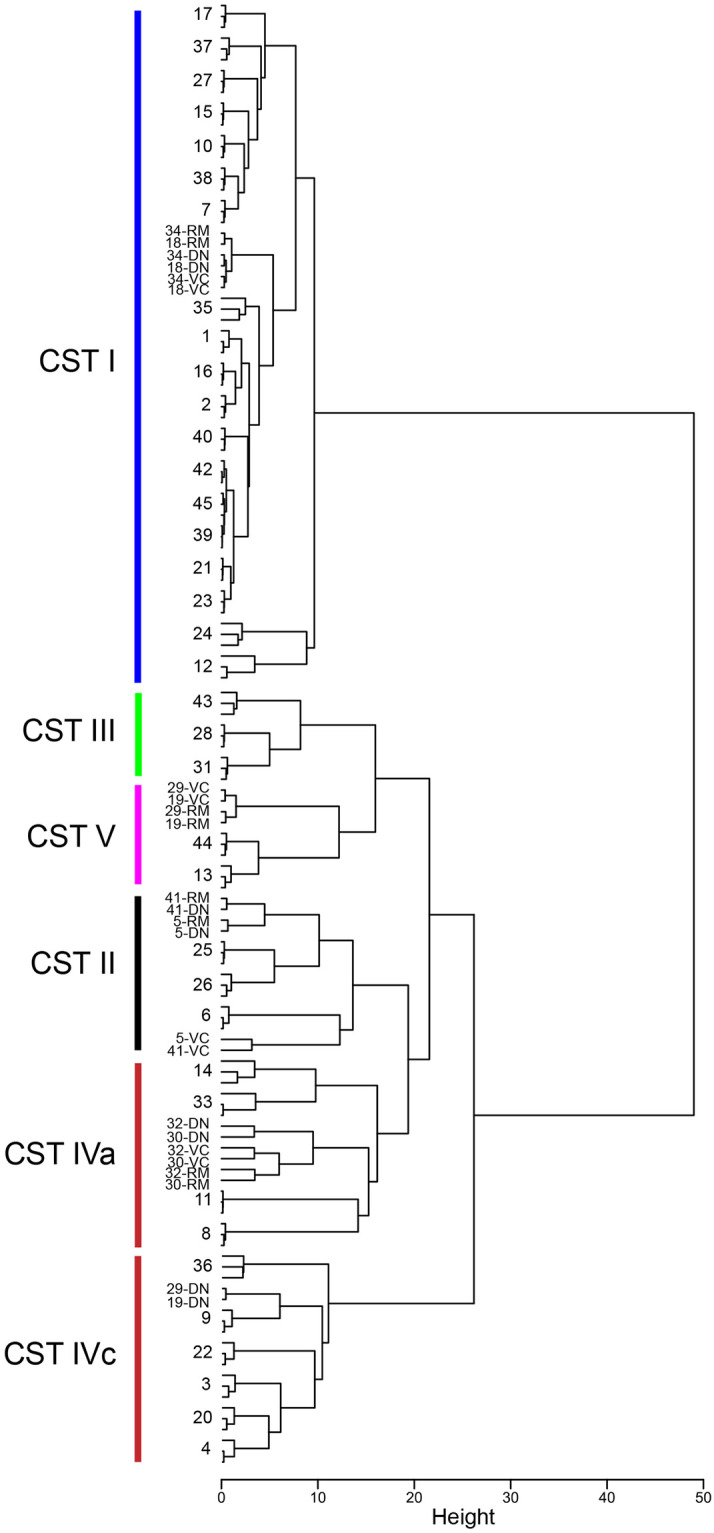
Fig 3. Comparison of microbiome profiles resulting from three methods of OTU generation.

Clustering of profiles from vaginal samples based on nearest neighbour species abundance with Jensen-Shannon distance calculation and hclust in R. In cases where the sample profiles from all methods cluster together, only the sample number is shown. RM = reference mapping, DN = de novo assembly, VC = variant calling. Clusters corresponding to CST I-IV are indicated, and are described in the text.
