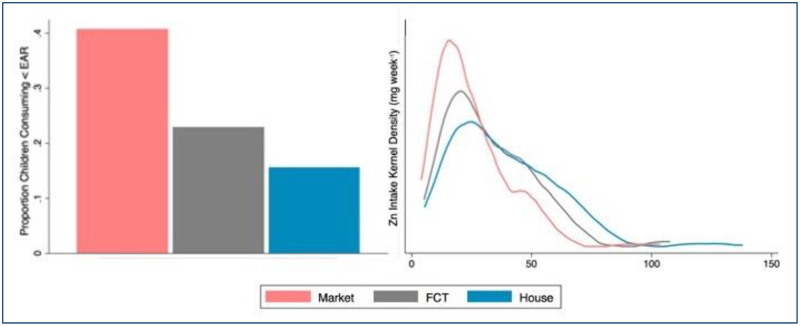
Fig 6. Prevalence of inadequate dietary Zn intake.
Left: Proportion of children whose estimated dietary Zn intake is inadequate (mg day-1 < EAR). Right: Kernel density distributions for estimated weekly Zn intake. For both graphics, “Market” denotes Zn concentrations measured in samples collected from markets, “FCT” denotes staple Zn concentrations reported in the HarvestPlus food composition table, and “House” denotes Zn concentrations measured in samples collected from households.

