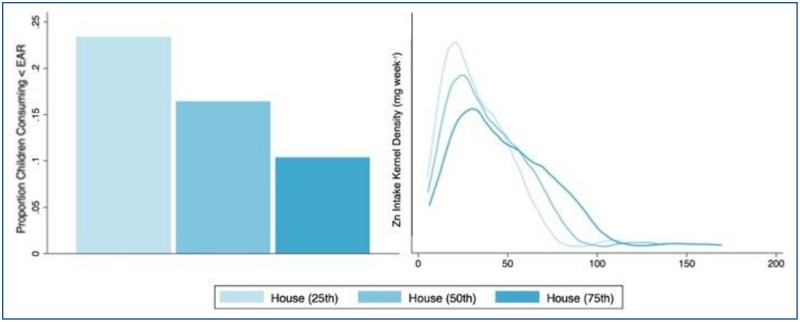
Fig 7. Prevalence of inadequate dietary Zn intake by household Zn concentration quantile.
Left: Proportion of children whose estimated dietary Zn intake is inadequate (mg day-1 < EAR). Right: Kernel density distributions for estimated weekly Zn intake. In both graphics, the values represent dietary intake estimates based on the 25th, 50th, and 75th percentiles of Zn concentrations measured in staples collected from household farms.

