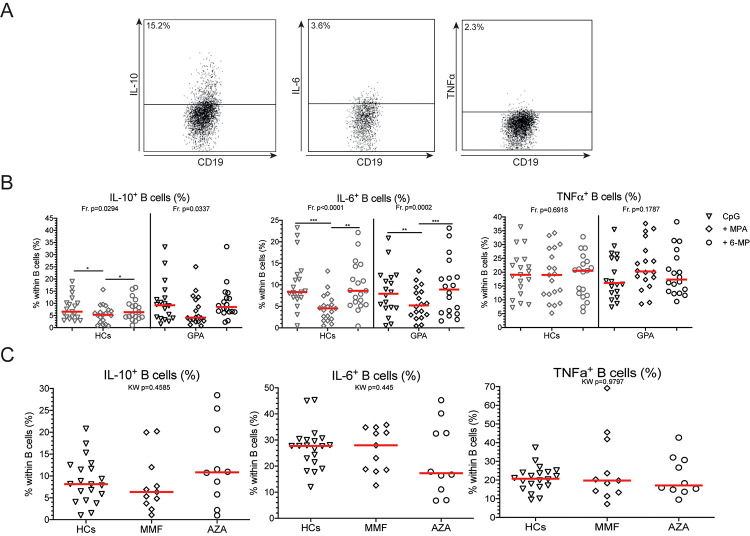
Fig 3. MPA decreases B cell IL-6 production.
A. Representative gating example of B cell cytokine production. All gates were set on the unstimulated sample for each donor. Within CD19+CD22+ B cells, IL-10+, IL-6+ and TNFα+ B cells were determined. B. The frequencies of all cytokine-positive B cells are depicted for HCs (grey) and GPA patients (black) in CpG only (open triangles), CpG+MPA (open diamonds), and CpG+6-MP (open circles) stimulated PBMCs. C. IL-10+, IL-6+ and TNF⍺+ B cell frequencies in HCs (open triangles), MMF-treated (open diamonds) and AZA-treated (open circles) GPA patients. Red lines represent the median value. *p<0.05, **p<0.01, ***p<0.001.

