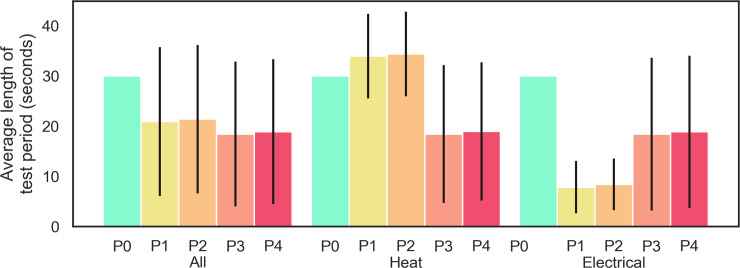
Fig 3. Data distribution across test periods with respect to all tests and then only heat or electrical tests.
Bars represent the mean duration of each test period (P0–P4), and the confidence interval shows individual period standard deviations; All–all 120 tests, Heat–only heat stimulus, and Electrical–only electrical stimulus.

