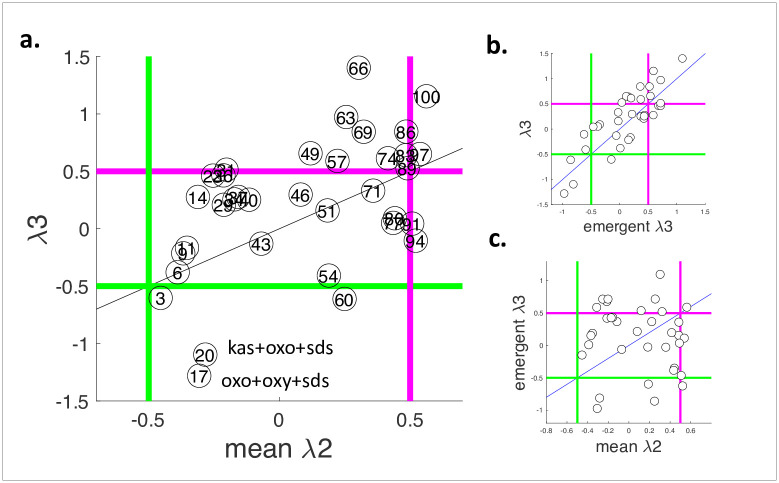
Fig 4. Prediction of three-drug interactions using the average of pairwise interaction scores.
(a) Each circle represents a tested three-drug interaction (A+B+C). x-axis shows the mean of pairwise interaction scores (A+B, A+C, B+C) λ2 and y-axis shows the empirically obtained three-drug interaction score λ3. Mean(λ2) and λ3 significantly correlated, indicating that three-drug interactions can be predicted using only pairwise interaction scores (Spearman r = 0.50, P-value = 2.1 x 10⁻³). kas+oxo+SDS and oxo+oxy+SDS were the strongest three-drug synergies. On each three-drug interaction, the percentile among mean(λ2) scores is indicated. kas+oxo+SDS and oxo+oxy+SDS are in the top 20 percentile. Green and magenta lines correspond to synergy (λ < -0.5) and antagonism (λ > 0.5) thresholds. (b) Three-drug interaction scores λ3 and emergent interaction scores (λ3—mean(λ2)) strongly correlate, indicating that emergent interactions contribute to three-drug interactions (Spearman r = 0.75, P-value = 1.7 x 10⁻⁷). (c) Mean(λ2) and emergent interaction scores had no significant correlation.

