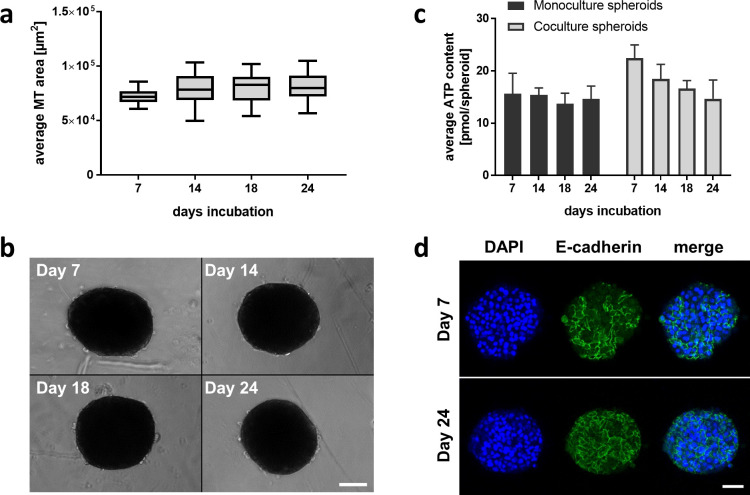
Fig 1. Viability and morphology of liver 3D spheroids during three weeks of continuous culturing.
a Size analysis of hepatocyte spheroids cultured for 24 days. Data is shown as multiples of the size at day 7, represented as average ± standard deviation (n = 16 spheroids per time point) b Bright-field images of spheroids on day 7, 14, 18, and 24. Scale bar = 50 μm. c Average ATP content of liver spheroids, cultured over 24 days, data represented in pmol/spheroid ± standard deviation (n = 16 spheroids per time point) d E-cadherin staining showing cell-cell interactions of hepatocytes at day 10 and day 24 post seeding, scale bar = 50 μm.

