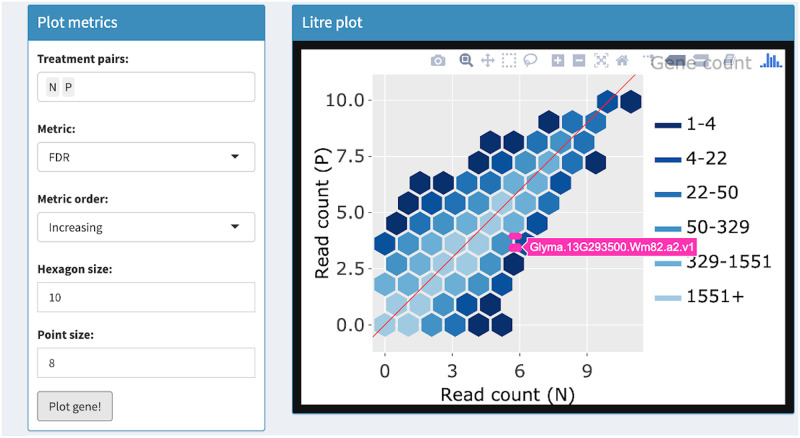
Fig 7. Step 3: Independent interactive layers of litre plot.
Third step in a four-part example series of user actions. User clicks “Plot gene” button again and the gene with the second-lowest FDR value (Glyma.13G293500.Wm82.a2.v1) is overlaid. This step does not require the background layer of hexagons to be redrawn.

