
Figure 1.
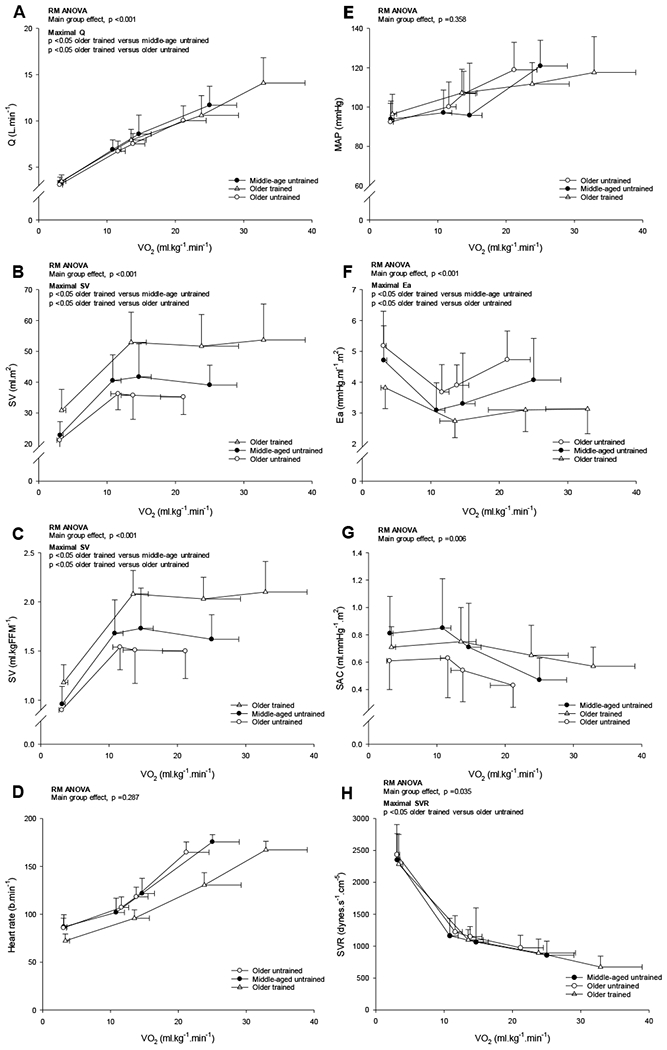
Q̇ (A), stroke volume relative to BSA (B), stroke volume relative to FFM (C), heart rate (D), mean arterial pressure (MAP; E), Ea (F), SAC (G) and SVR (H) as a function of V̇O2 relative to total body mass. Values are means ± SD with only statistically significant results at maximal exercise are indicated. Please refer to text for further details. P-values are derived from repeated measures ANOVA with post hoc analysis (Bonferroni t-tests method).
Number of observations for SV relative to FFM (MA n=21; OU n=35; OT n=12) and for MAP, Ea, SAC and SVR (MA n=21; OU n=35; OT n=13).