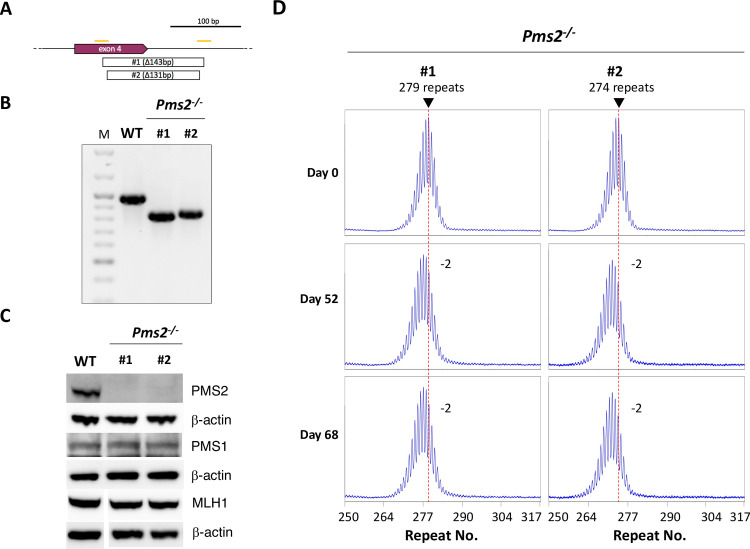
Fig 4. Generation and analysis of Pms2-/- cell lines.
A) Diagram of mutations generated in exon 4 of Pms2. Orange bars: CRISPR gRNA target. Open boxes: extent of CRISPR-induced deletion in the indicated lines. B) PCR analysis of DNA from Pms2+/+ cells and the two Pms2-/- CRISPant cell lines shown in panel A. M: 100 bp molecular weight ladder. C) Western blot demonstrating that the edited cells lack PMS2 and that the loss of PMS2 does not affect the levels of MLH1 or PMS1. Note that the lanes in the MLH1 western blot shown here are from the same blot shown in Figs 2C and 5C. D) Repeat PCR profiles of the two Pms2-/- lines after 0, 52 and 68 days in culture. The red dotted line on each profile indicates the major allele present in the cell population at day 0. The numbers indicate the change in the repeat number relative to day 0.

