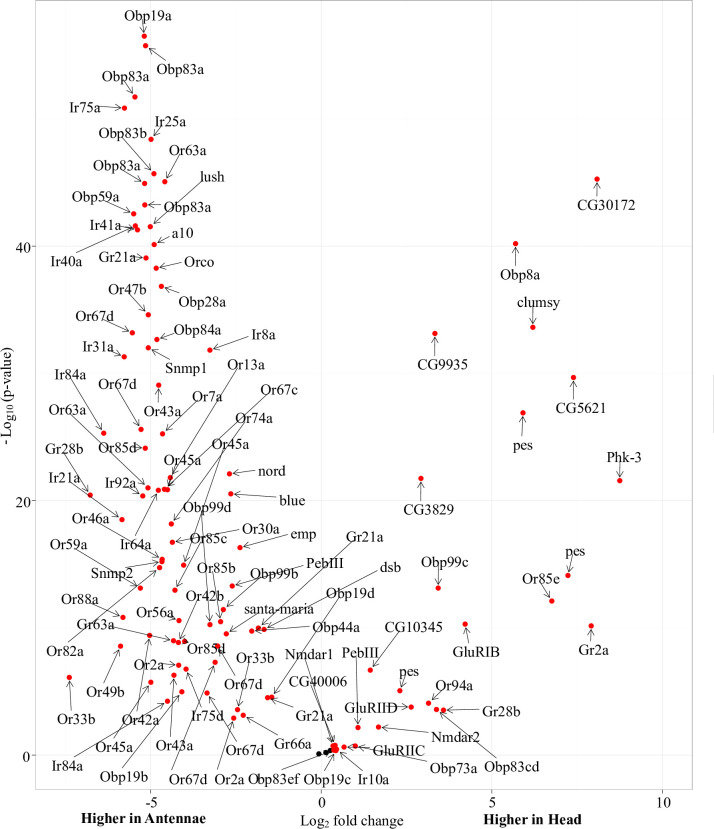
Fig 5. Volcano plot showing abundantly and significantly expressed chemosensory gene orthologs between the male G. m. morsitans head and antennae transcriptomes.
Dots indicate points-of-interest that display fold-changes (x axis) and statistical significance (-log10 of p value, y axis) in transcripts between the head and antennae transcriptomes. Red dots indicate transcripts with fold-changes of two or more (log2 ≥ 1) and False Detection Rate (FDR) corrected p values of less than 0.05 and are indicate transcripts with significant changes between the transcriptomes. Black dots represent transcripts with non-significant changes between the transcriptomes.

