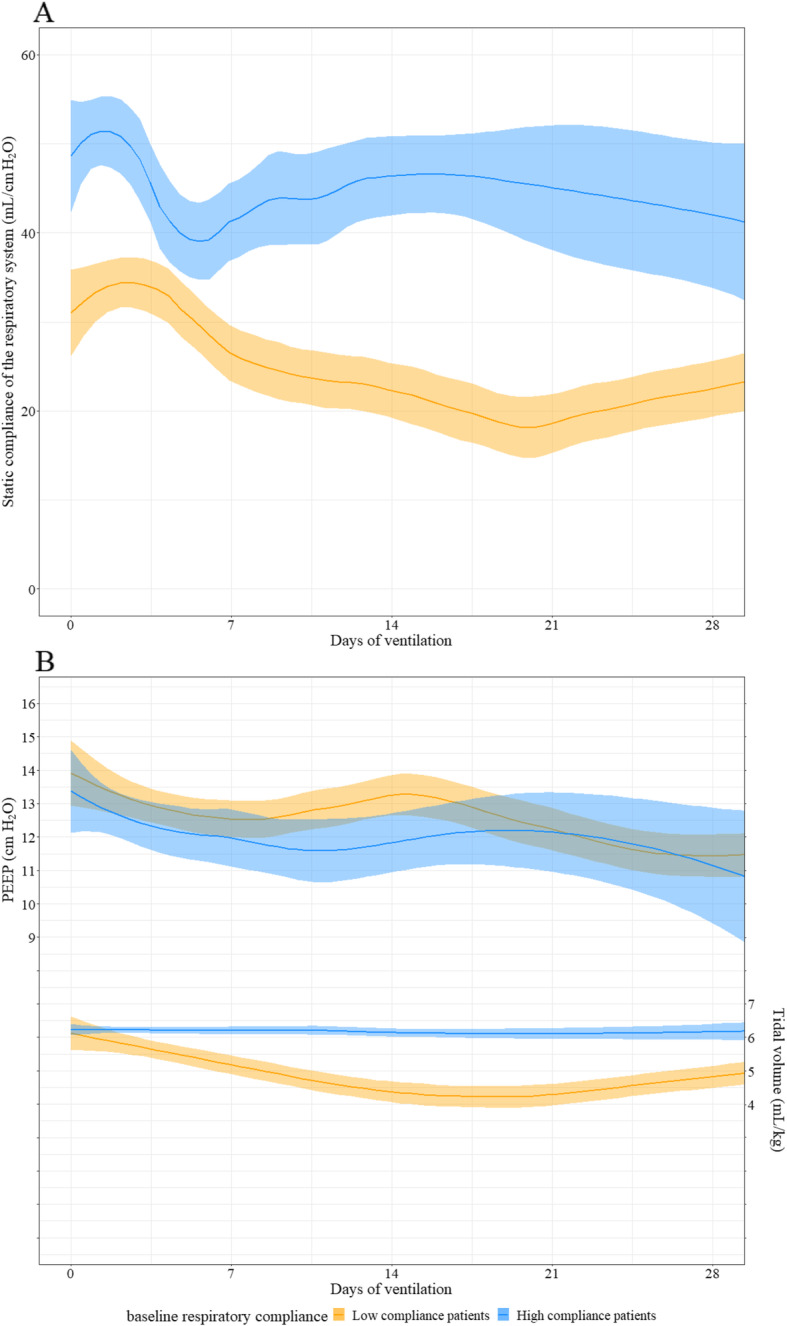
Fig. 1.

Course of the respiratory system static compliances (Cst-rs), positive end-expiratory pressures (PEEP), and tidal volumes (Vt). The means and 95% confidence intervals are represented respectively by solid lines and colored areas. Results are expressed in mean differences [95% CI]. a Cst-rs remained higher in the high initial Cst-rs group. There was no significant effect of time on Cst-rs (slope = − 0.03 mL/cmH2O/day of ventilation [95% CI − 0.17 to 0.12], P = 0.70). b PEEP levels did not differ between groups (high vs. low Cst-rs group − 0.69 cmH2O [95% CI − 2.05 to 0.66], P = 0.33). There was a statistically significant effect of time on PEEP (slope = − 0.10 cmH2O/day of ventilation [95% CI − 0.13 to − 0.06], P < 0.001). Vt were higher in the high Cst-rs group. There was no significant effect of time on Vt (slope = − 0.006 [− 0.02 to 0.007], P = 0.375)
