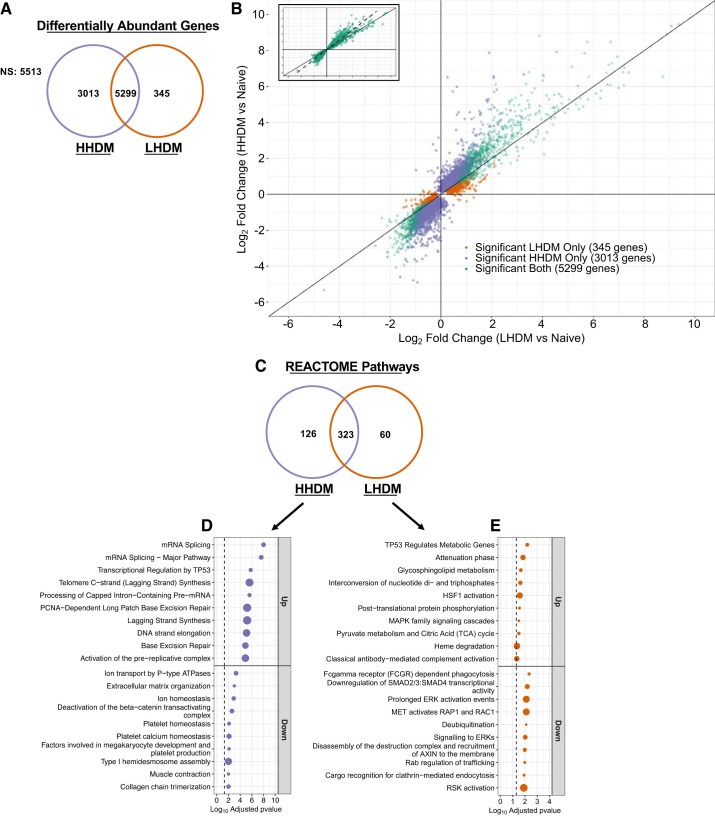
Fig. 3.
House dust mite (HDM) endotoxin abundance significantly alters lung transcriptomic profile. A: Venn diagram showing common and unique genes whose abundance is altered by HDM relative to control mice. NS, not significant. B: scatter plot comparing log2-fold change (FC) in low-endotoxin HDM (LHDM)-challenged animals (x-axis) vs. log2FC in high-endotoxin HDM (HHDM) challenged animals (y-axis) to identify unique and common genes in each data set. Diagonal line indicates line of equity (y = x). Inset: plots line of best fit for common genes (dashed line). C: Venn diagram showing overlap of REACTOME pathways between the 2 HDM lots. D and E: HHDM (D) and LHDM (E) unique altered REACTOME pathways. Point size indicates %enrichment for the pathways. Dashed line indicates adjusted. P value cutoff of 0.05; n = 4 female mice in control group; n = 5 in LHDM and HHDM group. Green: significant both HDM lots; orange: significant LHDM; purple: significant HHDM.

