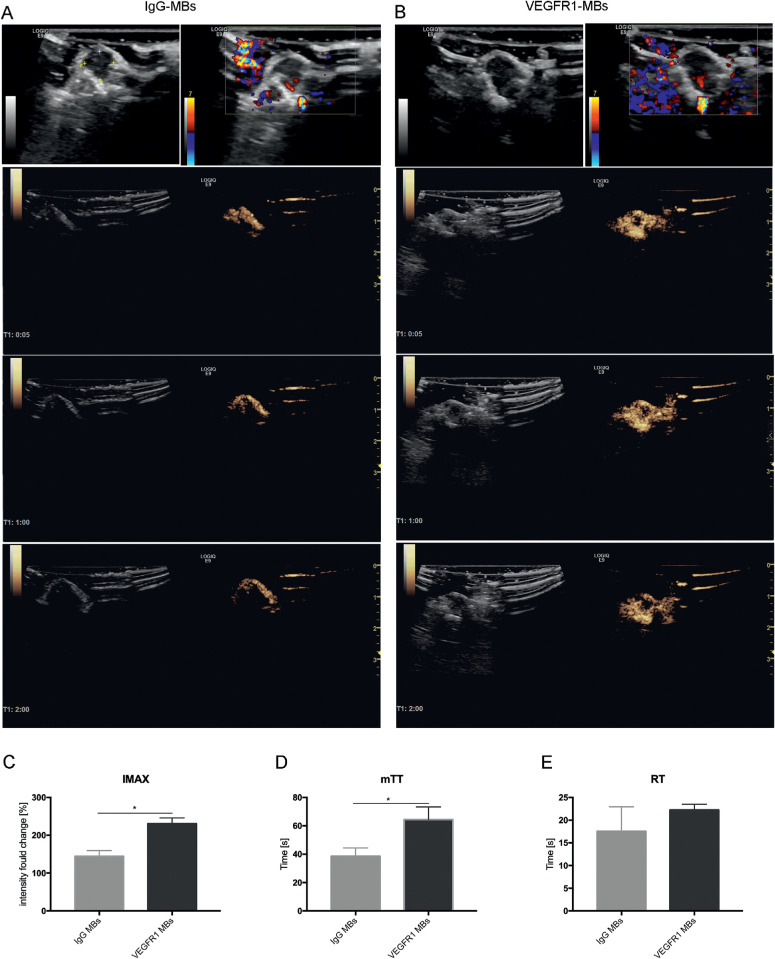
Figure 6.
Typical images of the comparison of IgG MB or VEGFR1 MB CEUS imaging in melanoma in vivo. (A, B) Typical images of CEUS imaging after IgG MB (A) or VEGFR1 MB (B) administration. B-mode images and CDI images (first row) are shown for tumor identification and visualization of flow within the tumor. CEUS images (second to fourth rows) were acquired at 5 seconds, 1 minute, and 2 minutes after injection. Bright yellow areas indicate signals of CEUS imaging. The three rows are the average intensity images from 6-second clips. (C–E) VEGFR1-targeted MB perfusion parameters were derived by digital subtraction from the background frame. IMAX, mTT, and RT were calculated from time–intensity curves for IgG MB imaging (A) and VEGFR1 MB imaging (B). Comparisons were performed with t-tests. (n. 5). *P < 0.05.

