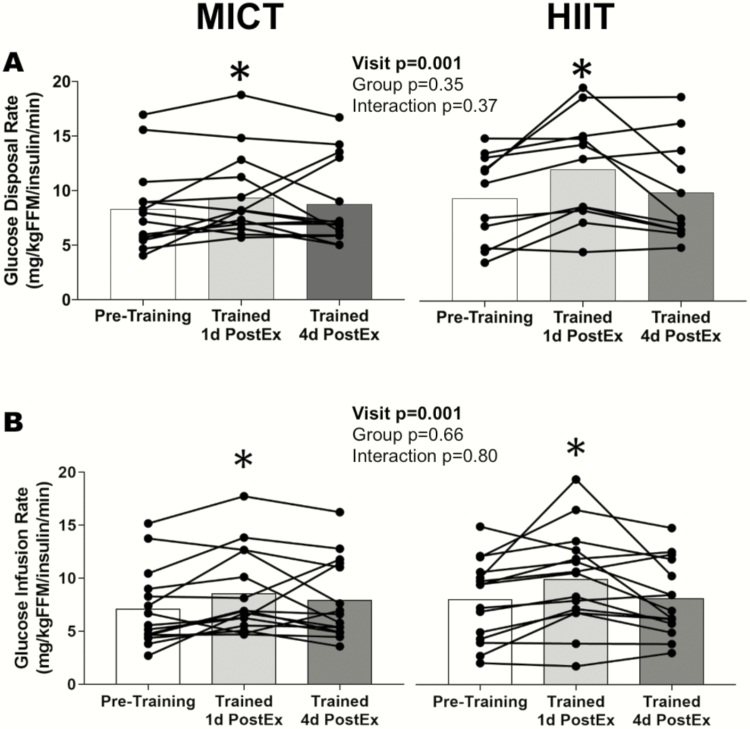
Figure 2.
Peripheral insulin sensitivity in response to training. (A) Rate of glucose disposal normalized to fat-free mass and insulin concentration during the hyperinsulinemic-euglycemic clamp (MICT n = 14, HIIT n = 11). (B) M-value: rate of exogenous glucose infusion normalized to fat-free mass and insulin concentration during the hyperinsulinemic-euglycemic clamp (MICT n = 15, HIIT n = 15). *Significant main effect for visit. Post hoc analysis identified trained 1d postEx was significantly greater than pretraining and trained 4d postEx (P < 0.05). The group means are indicated by bars and individual subjects’ data are connected by lines. HIIT, high-intensity interval training; MICT, moderate-intensity continuous training.

