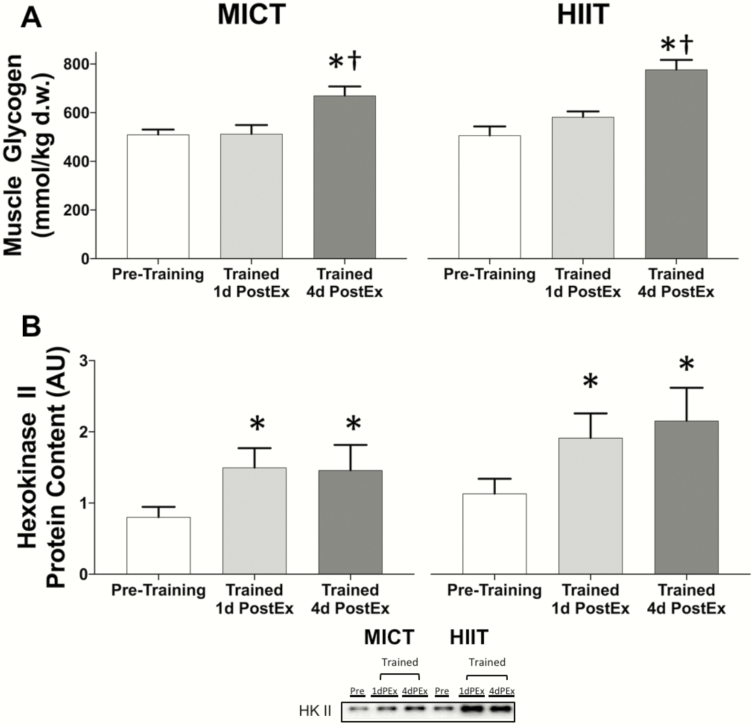
Figure 6.
Skeletal muscle glycogen content and hexokinase II protein abundance in response to training. (A) Muscle glycogen content (mmol per kilogram dry tissue weight). (B) Relative protein abundance of hexokinase II. Sample sizes were MICT n = 14 and HIIT n = 16. *Significant main effect of visit, with post hoc tests identifying a significant difference compared with pretraining (P < 0.05). †Significant main effect of visit, with post hoc tests identifying a significant difference compared with trained 1d postEx (P < 0.05). There were no significant main effects of group and no significant group × visit interactions. Data are presented as mean ± SEM. In the representative blots, “PEx” refers to postexercise. HIIT, high-intensity interval training; MICT, moderate-intensity continuous training.

