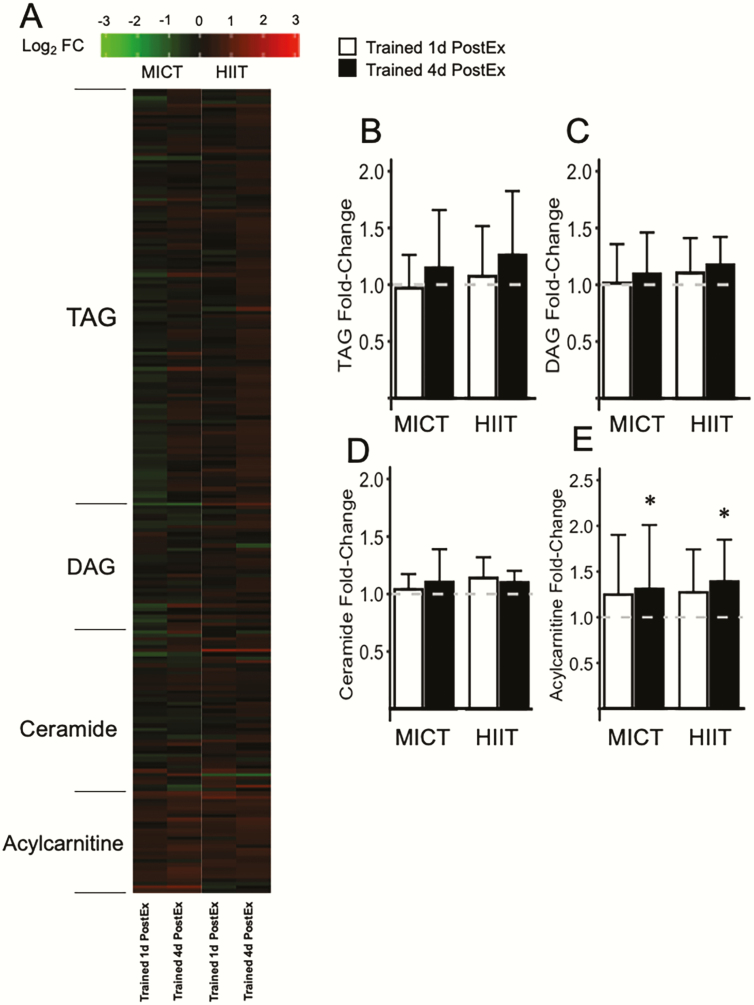
Figure 7.
Skeletal muscle triacylglycerol, diacylglycerol, ceramide, and acylcarnitine abundance in response to training. (A) Heatmap displaying log2 fold-change (log2 FC) relative to pretraining for individual triacylglycerol (TAG), diacylglycerol (DAG), ceramide, and acylcarnitine species. (B-E) Relative abundance of total TAG, DAG, ceramide, and acylcarnitine normalized to pretraining. The pretraining level is indicated by the dashed line at 1.0. *Significant main effect of visit compared with pretraining (P < 0.05). There were no significant main effects of group and no significant group × visit interactions. Data are presented as mean ± SD (MICT n = 9, HIIT n = 8). HIIT, high-intensity interval training; MICT, moderate-intensity continuous training.

