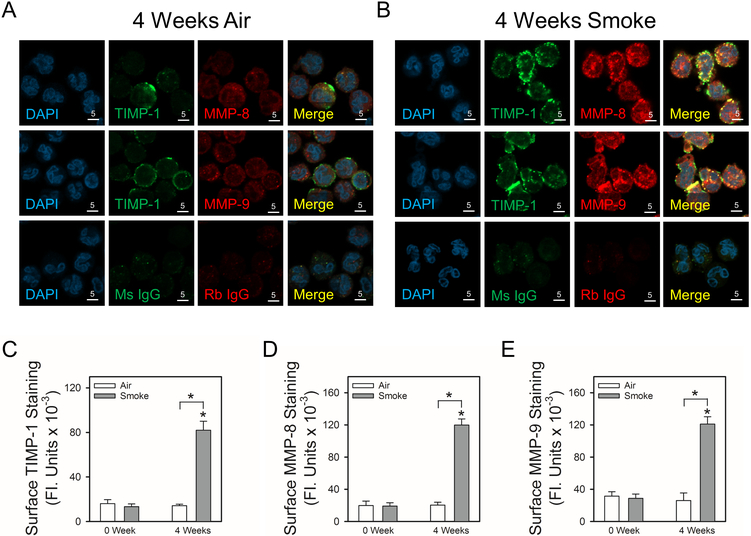
Figure 10: Exposure of non-human primate (NHP) to cigarette smoke increases co-localized expression of TIMP-1 with MMP-8 and MMP-9 on the surface of peripheral blood PMNs:
NHPs were exposed to air (n = 4; white bars) or smoke (n = 6; gray bars) for 4 weeks, and PMNs were isolated from peripheral blood samples from each animal both at baseline and after 4 weeks of air or CS exposure. Cells were double immunostained with Alexa 488 and murine anti-TIMP-1 IgG or non-immune murine (Ms) IgG (A and B second panels) and with Alexa 546 and rabbit anti-MMP-8 IgG or rabbit anti-MMP-9 IgG (A and B third panels). Nuclei in the cells were counterstained blue using 4’,6-diamidino-2-phenylindole (DAPI, A and B first panels). Co-localization of TIMP-1 and MMPs on the surface of PMNs was assessed using confocal microscopy (see merged images in the fourth panels in A and B). The white bars are 5 microns in length. In C-E, surface TIMP-1 or MMPs levels were quantified using image analysis software, as described in Methods. Data are mean + SEM; n = 4 air-exposed NHPs and n = 6 smoke-exposed NHPs (200–500 cells were analyzed per animal). In C-E, data were analyzed using a One-Way ANOVA followed by pair-wise testing with two-tailed Student’s t-tests. Asterisk indicates P < 0.001 compared with baseline or the group indicated.

