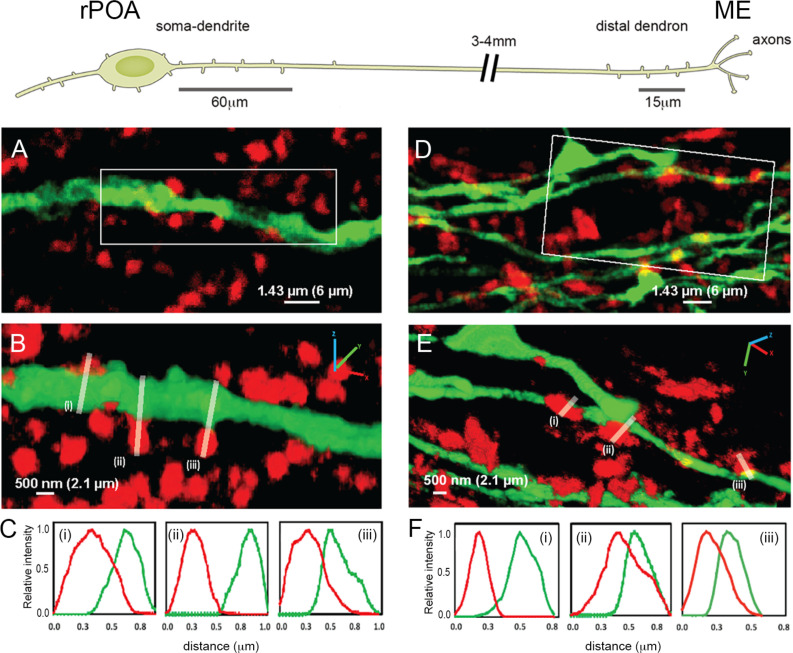
Figure 1. Expansion microscopy views of synaptic appositions at the GnRH neuron proximal dendrite and distal dendron.
Schematic showing the morphology of a hypophysiotropic GnRH neuron with its soma-proximal dendrites located in the rostral preoptic area (rPOA) and the distal dendron and short axon branches in the median eminence (ME). Synaptic density analysis was undertaken on 60 μm-lengths of proximal dendrite and 15 μm-lengths of distal dendron. (A) Expansion microscopy view of a proximal dendrite (green) with surrounding synaptophysin puncta (red). (B) shows rotated 3D reconstruction with white lines indicating three appositions that were examined. (C) The side-on relative fluorescence intensity profiles are shown for the three appositions. (i) and (iii) represent synaptic appositions whereas (ii) indicates apposing profiles with no overlap that do not represent a synapse. (D) Expansion microscopy view of distal dendrons (green) with surrounding red synaptophysin puncta. (E) shows rotated 3D reconstruction with white lines indicating three appositions that were examined. (F) The relative fluorescence intensity profiles are shown for the three appositions. (ii) and (iii) represent synaptic appositions, whereas (i) indicates apposing profiles with no overlap that do not represent a synapse. Scale bars show pre-expansion values with expanded size in brackets. X-axis plots show pre- expansion values.


