. 2020 Jul 9;9:e53945. doi: 10.7554/eLife.53945

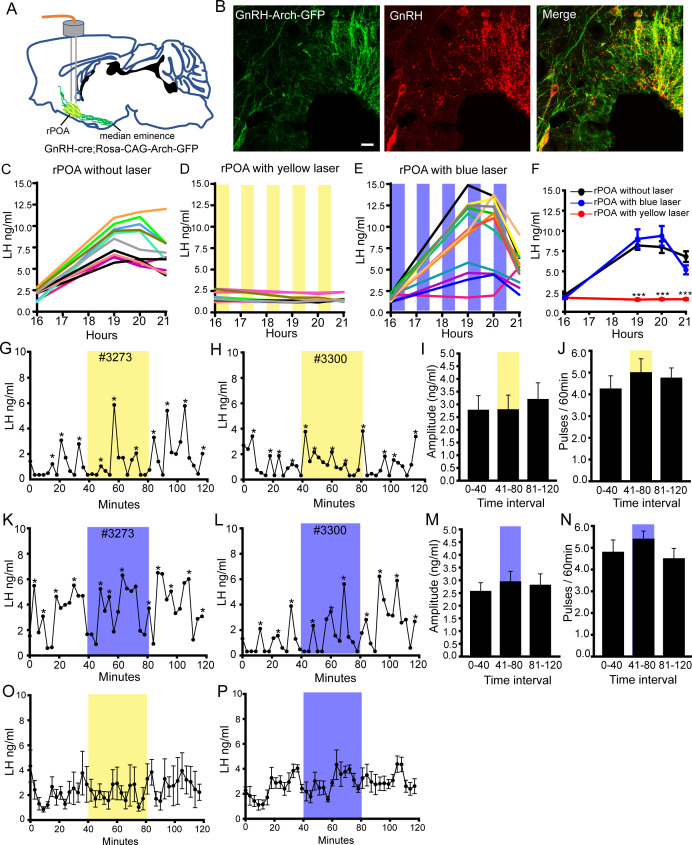
Figure 5. Bilateral optogenetic inhibition of GnRH neuron soma-proximal dendrite activity suppresses only the LH surge.

(A) Schematic showing experimental protocol with GnRH-cre+/-;Rosa-CAG-Arch-GFP+/+ mice with bilateral optic fiber placement in the rostral preoptic area (rPOA). (B) Fluorescence images of GnRH neurons expressing Archaerhodopsin (GFP reporter) and GnRH (red) in GnRH-cre+/-;Rosa-CAG-Arch3-GFP+/+ mice. Scale bar, 20 μm. (C-E) LH surge profiles in all control GnRH-cre+/-;Rosa-CAG-Arch-GFP+/+ OVX+E+P female mice (C, n = 11) and those given intermittent (yellow shaded areas) bilateral rPOA 593 nm illumination at 10 Hz (D, n = 12) or, as a control, 473 nm (E, n = 12). (F) Mean (± SEM) LH levels. ***p<0.001, two-way repeated measures ANOVA with Holm-Sidak test. (G-N) Representative profiles of pulsatile LH secretion in GnRH-cre+/-;Rosa-CAG-Arch3-GFP+/+ OVX female mice given 40 min (shaded areas) bilateral rPOA illumination at 593 nm (G, H) or, as a control, 473 nm (K, L). LH pulses are indicated by asterisks. Mean (± SEM) LH pulse amplitude and frequency are given for yellow (I,J, n = 7) and blue (M,N, n = 6) light illumination. (O,P) Mean (± SEM) LH levels in GnRH-cre+/-;Rosa-CAG-Arch-GFP+/+ OVX mice with bilateral rPOA laser illumination at 593 nm (O, n = 7) or 473 nm (P, n = 6).

Figure 5.

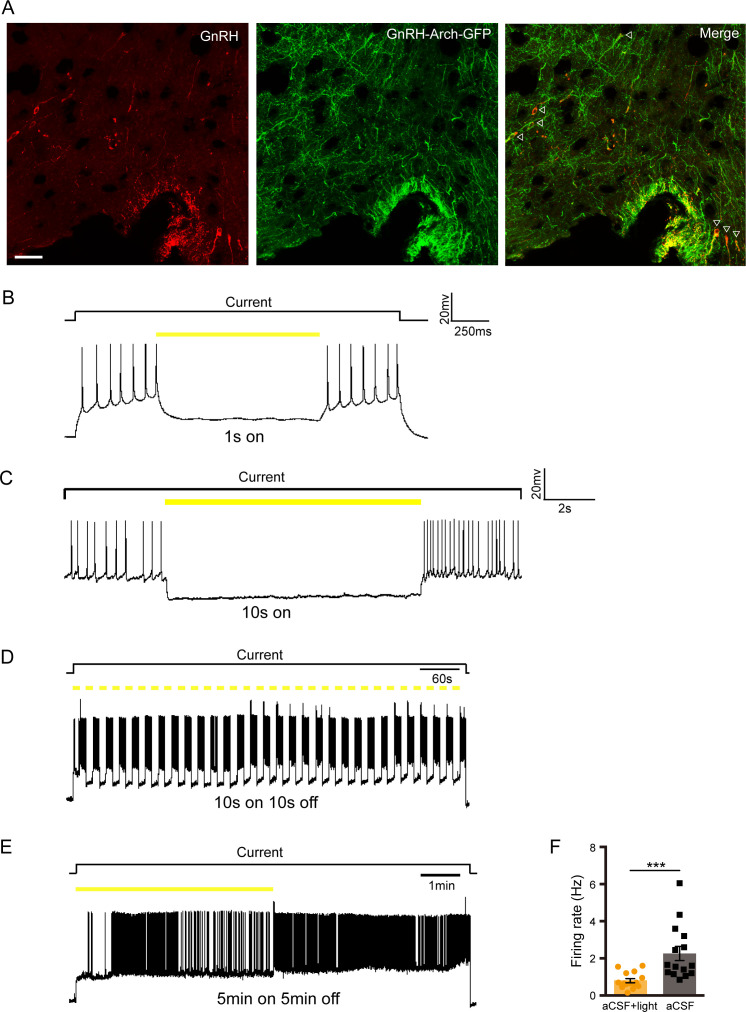
Figure 5—figure supplement 1. Archaerhodopsin expression in GnRH neurons and effects of yellow light on GnRH neuron firing.

Figure 5—figure supplement 1.

(A) Photomicrographs showing Archaerhodopsin (GFP reporter), GnRH (red), and overlay in the GnRH-cre+/-;Rosa-CAG-Arch3-GFP+/+ mice. Scale bar, 50 µm. Whole cell current clamp recordings of Archaerhodopsin-expressing rPOA GnRH neurons showing their response to 1 s (B) and 10 s (C) yellow-light. (D) Example traces illustrating the response of an rPOA GnRH neuron to a 10-min yellow light stimulation train at 10 s on 10 s off. (E) Example traces illustrating the response of an rPOA GnRH neuron to a 10 min yellow light stimulation at 5 min on 5 min off. (F) The mean firing rate of an rPOA GnRH neuron with or without 5 min continuous yellow light. **p<0.001, repeated measures ANOVA.
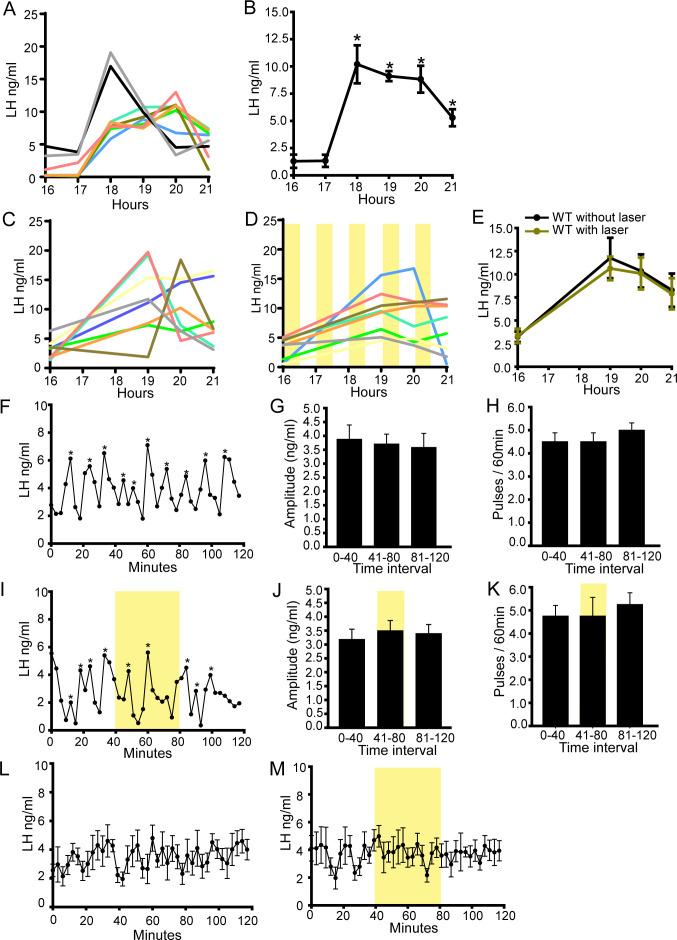
Figure 5—figure supplement 2. LH surge in GnRH-Arch mice and optogenetic control experiments showing effects of yellow light on the LH surge and pulses in wild-type mice.

Figure 5—figure supplement 2.

(A) LH surge profiles in individual GnRH-Cre+/-;Rosa-CAG-Arch-GFP+/+ OVX+E+P female mice over 6 hr, with tail-tip blood sampling every hour. (B) Mean (± SEM) LH surge profile. Values significantly different from basal LH concentrations are indicated by an asterisk (p<0.05, repeated measures ANOVA). (C-D) LH surge profiles without (C, n = 8) or with (D, n = 8) unilateral 593 nm laser illumination in MBH of wild-type OVX+E+P female mice. (E) Mean LH levels. (F-M), Representative profiles of pulsatile LH secretion in wild-type OVX female mice without (F) or with (I, shaded areas) bilateral rPOA illumination at 593 nm for 40 min. LH pulses are indicated by asterisks. Mean (± SEM) LH pulse amplitude and frequency are given without (G,H, n = 6) or with (J,K, n = 6) bilateral rPOA 593 nm laser illumination. (L,M) Mean (± SEM) LH levels in wild-type OVX female mice without (L, n = 6) or with (M, n = 6) bilateral rPOA 593 nm laser illumination.