. 2020 Jun 12;9:e53247. doi: 10.7554/eLife.53247

Figure 1. FAO genes are expressed in hemocyte progenitors of lymph gland.

Age and genotype of the larvae are mentioned in respective panels. (A–A') Model of lymph gland of third early and third late instar stages depicting anterior primary lobes and posterior lobes. (A’). Primary lobe showing different subpopulations: Pvf2+ Dome- pre-progenitor, Dome+ progenitors and Dome+ Pxn+ HmlIntermediate progenitors (IPs) in early third and late third instar larval stages. Progenitors are present in the core of the primary lobe called the medullary zone (MZ), and differentiated cells (Plasmatocytes and crystal cells) are present in the outer zone called cortical zone (CZ). (B–B'') Expression of Hnf4-GAL4 > UAS-GFP in Pvf2+ pre-progenitors of the early third instar lymph gland. (C–C'') Expression of Hnf4-GAL4 > UAS-GFP in Dome+ progenitors and Dome+ HmlIntermediate progenitors (IPs) shown in dome-MESO-EBFP2/+; Hml-DsRed/+ genotype. (D). Quantitative analysis of B–C''- reveals that the Dome+ progenitors have higher levels of Hnf4 expression. p-Value for Hnf4-GAL4 > UAS-GFP expression in Dome+ progenitors is 9.55 × 10⁻⁹ compared to control Pvf2+ pre-progenitors. p-Value for Hnf4-GAL4 > UAS-GFP expression for Dome+ Hml+ IPs is 7.34 × 10⁻³ compared to control Pvf2+ pre-progenitors. (E–E'') Nile red staining in Pvf2+ pre-progenitors of early third instar stage lymph gland. (F–F'') Expression of Nile red in Dome+ progenitors and Dome+ HmlIntermediate progenitors (IPs) shown in dome-MESO-EBFP2/+; Hml-DsRed/+ genotype (Dome+: blue, Hml+: green). (G). Quantitative analysis of E–F'' shows higher levels of neutral lipids in the Dome+ progenitors. Compared to control Pvf2+ pre-progenitors, p-Values for nile red expression in Dome+ progenitors is 1.39 × 10⁻⁷ and Dome+ Hml+ IPs pre-progenitors is 9.11 × 10⁻³. Five optical sections of 1 µm thickness from the middle of the Z-stack were merged into a single section. (H) Schematic representation of FAO and the constituent enzymes. (I) Transcripts of β-oxidation enzymes, whd, Mcad, Mtpα, scully, Mtpβ, and yip2 (Refer to H) can be detected in the third late instar lymph gland. eL3 and lL3 refer to the early and late instar lymph glands. Individual dots represent biological replicates. Values are mean ± SD, asterisks mark statistically significant differences (*p<0.05; **p<0.01; ***p<0.001, Student’s t-test). Scale bar: 20 µm.

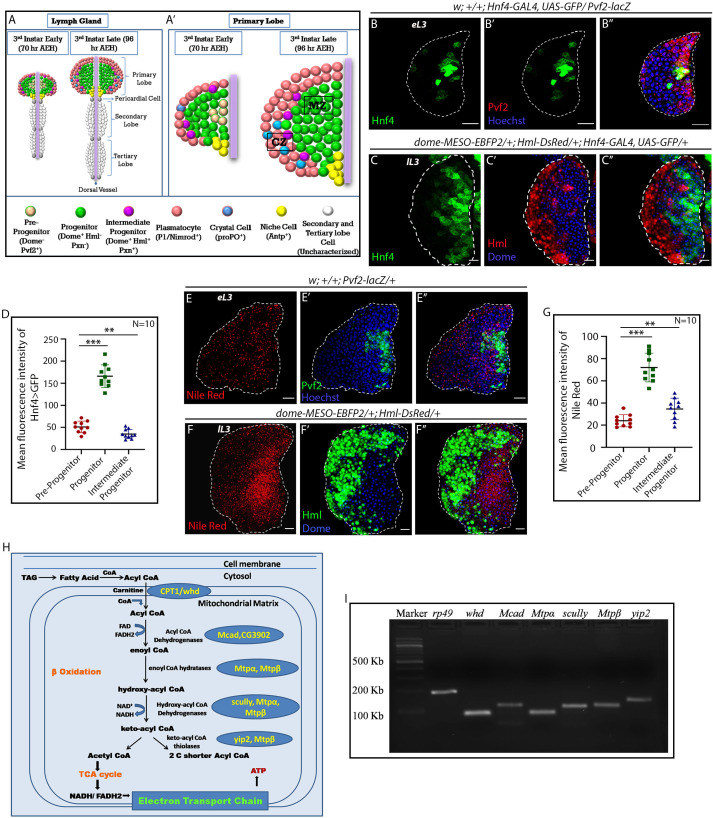
Figure 1—source data 1. Contains numerical data plotted in Figure 1D and G.

Figure 1.

Figure 1—figure supplement 1. Temporal analysis of pre-progenitors in the lymph gland and mitochondrial analysis in Dome+ progenitors.

Figure 1—figure supplement 1.

Age and genotype of the larvae are mentioned in respective panels. (A–B) Expression of Pvf2 in Dome- pre-progenitors in third early instar lymph gland (A) late third instar lymph glands lack Pvf2 expression as well as Dome- pre-progenitors (B). (C–C') Super-resolution image of mitochondria in Dome+ progenitors visualized by dome-GAL4, UAS::mCD8RFP/+; UAS-mito-HA-GFP. Five optical sections of 0.33 µm thickness from the middle of the Z -stack were merged into a single section. (C') is the higher magnification of region of interest (ROI) from C). (D–D') Image of mitochondria in Hml+ differentiated hemocytes and Hml- progenitors of the lymph gland visualized by Streptavidin-Cy3. (D') is the higher magnification of ROI from D. eL3 and lL3 refer to the early and late instar lymph glands. Scale bar: 20 µm.

Figure 1—figure supplement 2. FAO components are expressed in hemocyte progenitor subpopulations in the lymph gland.

Figure 1—figure supplement 2.

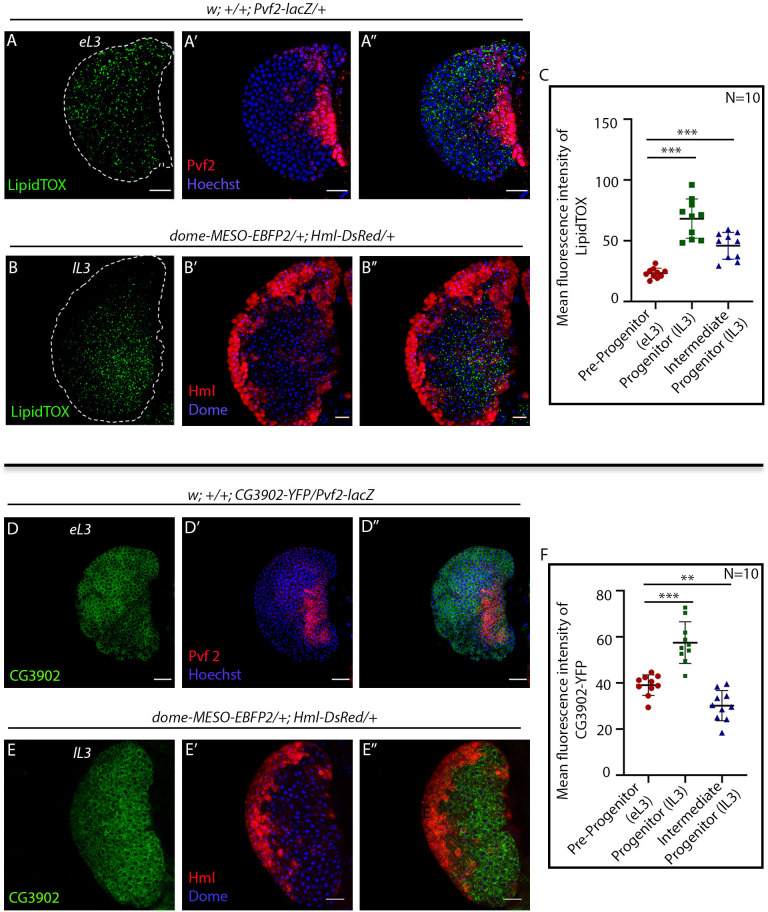
Age and genotype of the larvae are mentioned in respective panels. (A–A'') LipidTOX labeling neutral lipids in Pvf2+ pre-progenitors in the early third instar lymph gland. (B–B''). LipidTOX labeling in Dome+ progenitors and Dome+ HmlIntermediate progenitors (IPs) shown in dome-MESO-EBFP2/+; Hml-DsRed/+ genotype. (C). Quantitative analysis of results from A–B'' showing a higher level of neutral lipids in Dome+ progenitors. Compared to control Pvf2+ pre-progenitors, p-Values for lipidTOX labeling in Dome+ progenitors is 6.20 × 10⁻⁶ and Dome+ Hml+ IPs is 6.84 × 10⁻⁵. Five optical sections of 1 µm thickness from the middle of a the Z-stack were merged into a single section. (D–D'') Expression of acyl-CoA dehydrogenase, CG3902-YFP expression in Pvf2+ pre-progenitors in the early third instar lymph gland. (E–E''). CG3902-YFP expression in Dome+ progenitors and Dome+ HmlIntermediate progenitors (IPs) shown in dome-MESO-EBFP2/+; Hml-DsRed/+ genotype. (F). Quantitative analysis of results from D–E'' reveals high levels of CG3902-YFP expression in the Dome+ progenitors. p-value for CG3902-YFP labeling in Dome+ progenitors is 6.02 × 10⁻⁵ compared to control Pvf2+ pre-progenitors and for Dome+ Hml+ IPs is 2.70 × 10⁻³. Five optical sections of 1 µm thickness from the middle of the Z-stack were merged into a single section. Individual dots represent biological replicates. Values are mean ± SD, asterisks mark statistically significant differences (*p<0.05; **p<0.01; ***p<0.001, Student’s t-test). Scale bar: 20 µm.
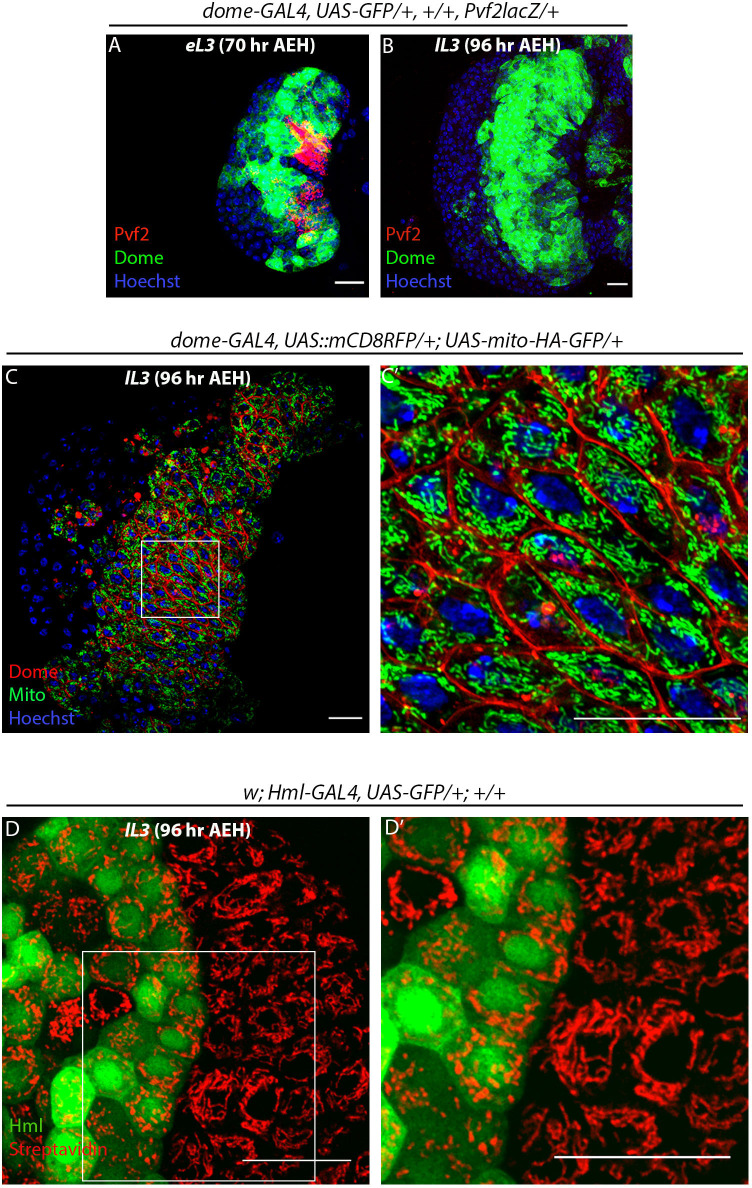
Figure 1—figure supplement 2—source data 1. Contains numerical data plotted in Figure 1—figure supplement 2C and F.