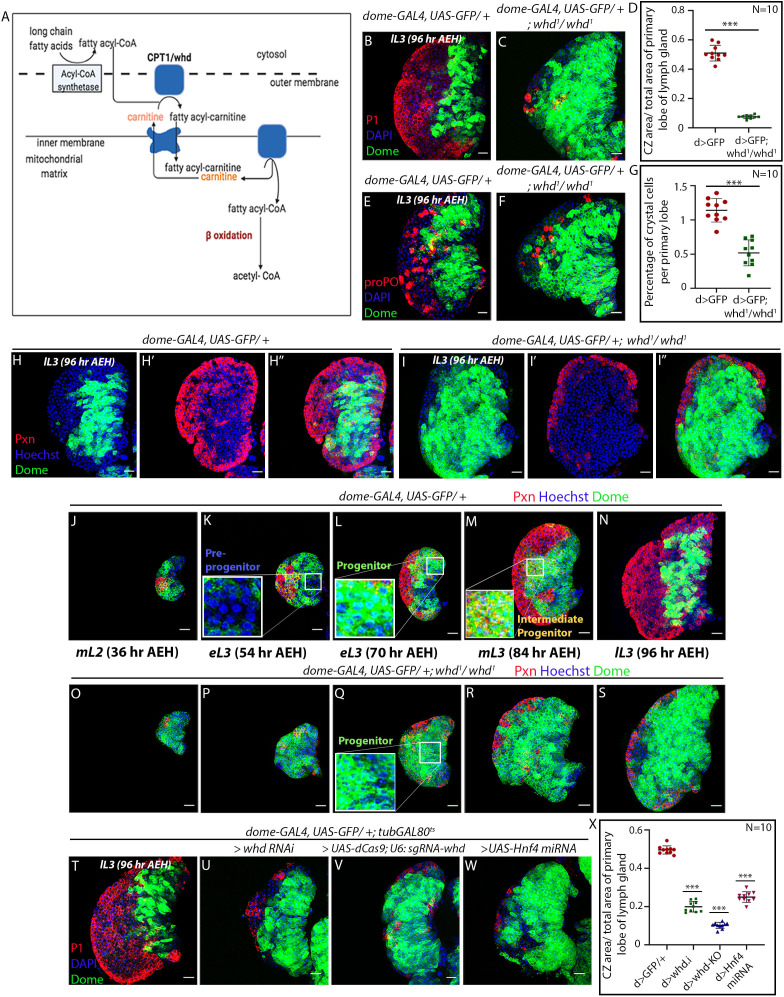
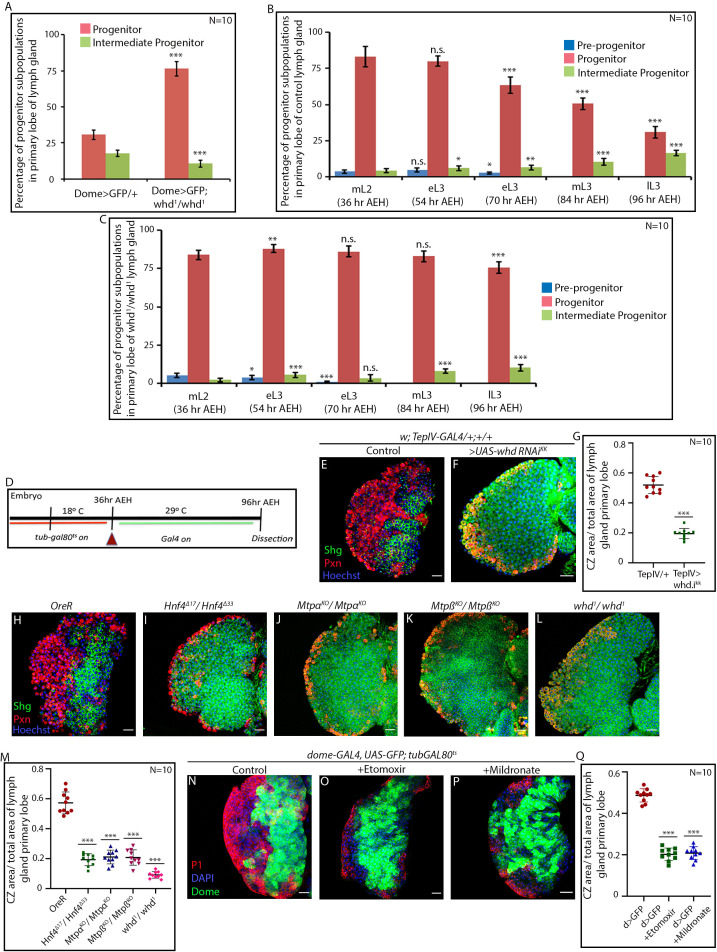
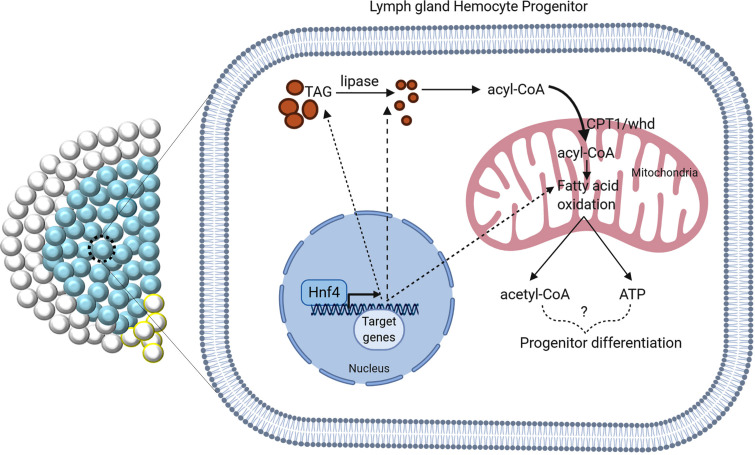
Figure 2. Loss of fatty acid β-oxidation affected differentiation of hemocyte progenitors of the lymph gland.
(A) Schematic representation of fatty acid β-oxidation within the mitochondria of a cell. (B–D) Compared to control (B) decrease in differentiation (red, reported by P1 immunostaining) and increment in progenitor number (dome > GFP) is observed in the lymph gland of a homozygous null allele of whd (C). (D) Quantitative analysis of B–C reveals a significant increment in the number of Dome+ progenitors. p-Value for dome-GAL4, UAS-GFP; whd1/whd1=2.67×10−10 compared to control. (E–G) Compared to control (E) decrease in crystal cell number (red, reported by proPO immunostaining) and increment in the progenitor cell population (dome > GFP) is observed in the lymph gland of the homozygous null allele of whd (F). (G). Quantitative analysis of results from E–F shows a significant drop in the number of crystal cells. p-Value for dome-GAL4, UAS-GFP; whd1/whd1=4.38×10−7 compared to control. (H–I'') The hemocyte progenitor subpopulation dynamics (red, reported by Pxn immunostaining and green marking dome > GFP) of Dome+ progenitors and Dome+ Pxn+ (IPs) in the late third instar lymph gland of control (H–H'') and homozygous null allele of whd (I–I''). (J–S) Spatio-temporal analysis of hemocyte progenitor subpopulations of Dome- pre-progenitors, Dome+ progenitors, and Dome+ Pxn+ (IPs) (red, reported by Pxn immunostaining and green marking dome > GFP) observed in the lymph gland of control (J–N) and homozygous null allele of whd (O–S). Insets in K, L, and M show pre-progenitors, progenitors and intermediate progenitors respectively in control and inset in Q shows abundant progenitors in the homozygous null allele of whd. (T–X) Compared to control (T) decrease in differentiation (red, reported by P1 immunostaining) and increase in progenitor number (dome > GFP) is observed in lymph gland upon progenitor specific RNAi based down-regulation of whd (U) CRISPR-Cas9 based knock-out of whd (V) and miRNA based knockdown of Hnf4 (W). (X) Quantitative analysis of the results from T–W, illustrating the significant increase in Dome+ progenitors upon targeted loss of FAO. p-Value for dome-GAL4, UAS-GFP; tubGAL80ts20 > UAS-whd RNAi = 2.84×10⁻¹⁵ compared to control. p-Value for dome-GAL4, UAS-GFP; tubGAL80ts20 > UAS-dCas9; U-6: sgRNA-whd = 3.84×10⁻¹⁹. p-Value for dome-GAL4, UAS-GFP; tubGAL80ts20 > UAS-Hnf4.miRNA =6.04×10⁻¹⁴. Individual dots represent biological replicates. Values are mean ± SD, asterisks mark statistically significant differences (*p<0.05; **p<0.01; ***p<0.001, Student’s t-test). Scale bar: 20 µm.


