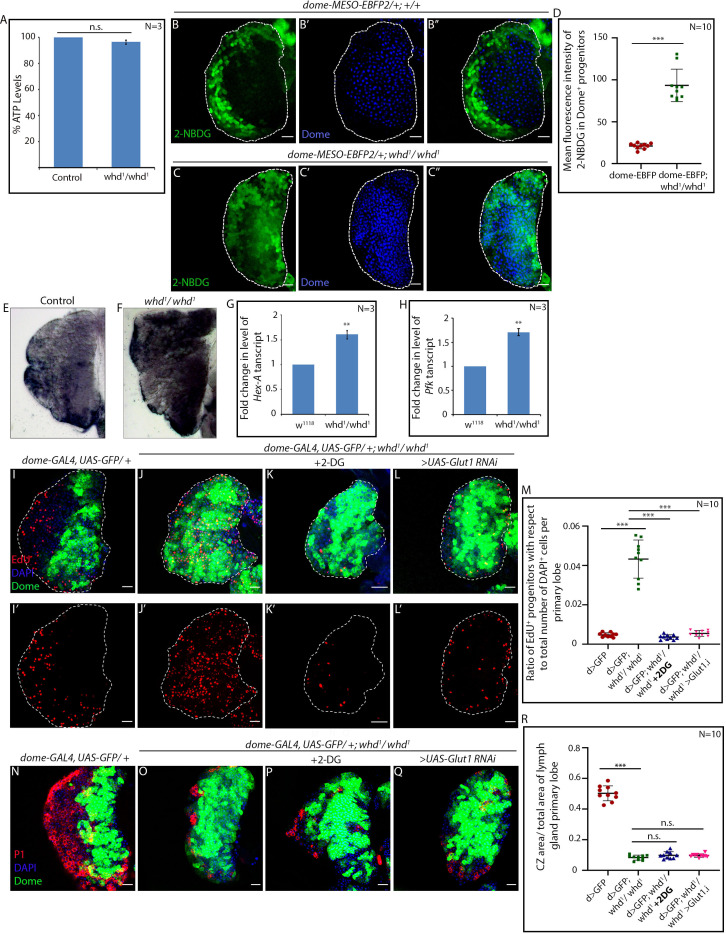
Figure 5. FAO loss in hemocyte progenitors led to sustained glycolysis.
(A) ATP levels in control and whd1/whd1 whole larvae. p-Value of whd1/whd1compared to control = 5.327×10⁻². (B–D) Glucose incorporation (marked by 2-NBDG uptake) levels in control dome-MESO-EBFP2/+ (B–B'') and dome-MESO-EBFP2/+; whd1/whd1 (C–C'') lymph glands. (D). Quantitative analysis of results from B–C demonstrating a significant increase in glucose uptake in the whd1/whd1 progenitors. p-Value for dome-MESO-EBFP2/+; whd1/whd1 = 6.09×10⁻⁷ compared to control. (E–F) Increased lactate dehydrogenase in-vivo enzymatic staining assay of whd1/whd1 lymph gland (F) compared to control (E). (G) Fold change in the level of Hex-A mRNA expression in control w1118 and whd1/whd1 lymph glands. p-Value of whd1/whd1 = 6.379×10⁻³ compared to control. (H) Fold change in the level of Pfk mRNA expression in control w1118 and whd1/whd1 lymph glands. p-Value of whd1/whd1 = 3.739×10⁻³ compared to control. (I–M) Proliferation status (marked by EdU) in control dome > GFP (I–I'), dome > GFP; whd1/whd1 (J–J'), 2-DG fed dome > GFP; whd1/whd1 (K–K') and dome > GFP; whd1/whd1; UAS-Glut1 RNAi (L–L') lymph glands. (M). Quantitative analysis of results from I–L'. p-Value for dome > GFP; whd1/whd1 = 4.37×10⁻⁷ compared to control and p-value for dome > GFP; whd1/whd1 = 3.25×10⁻⁷ fed with 2-DG compared to non-fed dome > GFP; whd1/whd1. p-Value for dome > GFP; whd1/whd1; UAS-Glut1 RNAi = 4.53×10⁻⁷ compared to non-fed dome > GFP; whd1/whd1. (M–P) Comparison of differentiation (marked by P1) levels in control dome > GFP (M), dome > GFP; whd1/whd1 (N) and 2-DG fed dome > GFP; whd1/whd1 (O) lymph glands. (P). Quantitative analysis of results from M–O show decline in proliferation upon 2-DG feeding. p-Value for dome > GFP; whd1/whd1 = 4.43×10⁻¹¹ compared to control and p-Value for dome > GFP; whd1/whd1 = 8.6×10⁻² fed with 2-DG compared to non-fed dome > GFP; whd1/whd1. p-Value for dome > GFP; whd1/whd1; UAS-Glut1 RNAi = 5.9×10⁻² compared to non-fed dome > GFP; whd1/whd1. n.s. = not significant. Individual dots represent biological replicates. Values are mean ± SD, asterisks mark statistically significant differences (*p<0.05; **p<0.01; ***p<0.001, Student’s t-test). Scale bar: 20 µm.


