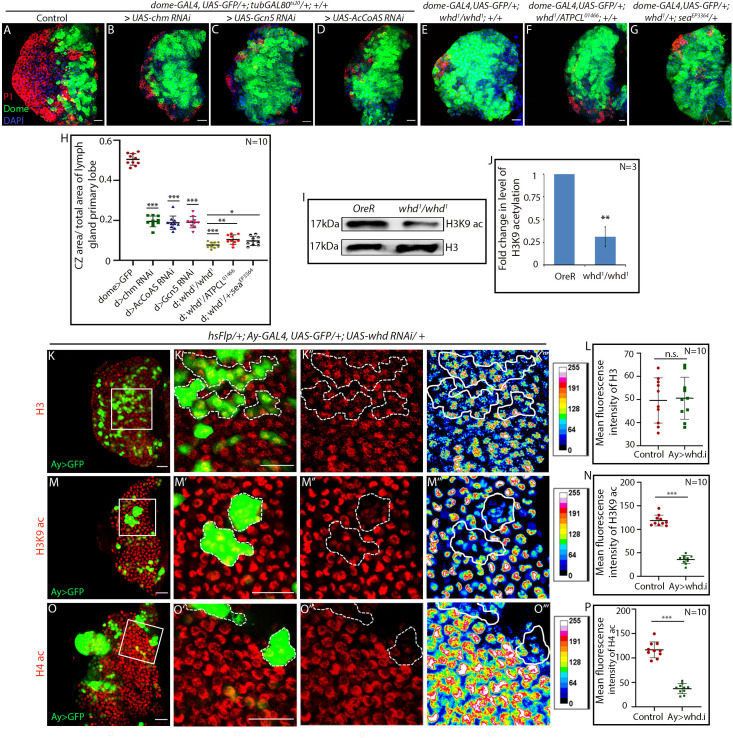
Figure 6. Hemocyte progenitors of HAT and FAO loss of function exhibits altered histone acetylation.
(A–H) Comparison of differentiation (marked by P1) levels in dome > GFP lymph gland of control (A) with progenitor-specific downregulation of (B) chm, (C) Gcn5, (D) AcCoAS and (E) whd1/whd1, (F) transheterozygote of whd and ATPCL (whd1/ATPCL01466) and transheterozygote of whd and sea (whd1/seaEPEP3364) (G). (H) Quantitative analyses of the results from A–G. p-Value for dome-GAL4, UAS-GFP; tubGAL80ts20 > UAS-chm RNAi = 2.267×10⁻¹⁵ compared to control. p-Value for dome-GAL4, UAS-GFP; tubGAL80ts20 > UAS-Gcn5 RNAi = 1.990×10⁻¹⁴ compared to control. p-Value for dome-GAL4, UAS-GFP; tubGAL80ts20 > UAS-AcCoAS RNAi = 2.601×10⁻¹⁵ compared to control. p-Value for dome-GAL4, UAS-GFP; whd1/whd1 = 1.400×10⁻¹⁵ compared to control. p-Value for dome-GAL4, UAS-GFP; whd1/ATPCL01466 = 6.835×10⁻³ compared to control dome-GAL4, UAS-GFP; whd1/whd1. p-Value for dome-GAL4, UAS-GFP; whd1/seaEP3364 = 2.974×10⁻² compared to control dome-GAL4, UAS-GFP; whd1/whd1. (I–J) Western blot analysis of H3K9 acetylation level in control OreR and whd1/whd1 larvae with H3 as a loading control (I). (J). Quantitative analysis of H3K9 acetylation level in I. p-Value for whd1/whd1 = 8.056×10⁻³ compared to control OreR. (K–P) Clonal analysis of histone acetylation in the GFP-positive hs-Flp/Ay-GAL4 based clonal patches (GFP indicates cells where the whd function is knocked down). Immunostaining with H3 (K–L), H3K9 acetylation (M–N), and H4 pan acetylation (O–P) antibodies. (L). Quantitative analyses of H3 acetylation level in K–K'''. p-Value for hs-Flp/Ay-GAL4. UAS-GFP; UAS-whd RNAi = 8.188×10⁻¹ compared to control. (N). Quantitative analysis of H3K9 acetylation level in (M–M'''). p-Value for hsFlp/+; Ay-GAL4. UAS-GFP; UAS-whd RNAi = 2.238×10⁻¹² compared to control. (P). Quantitative analysis of H4 acetylation level in O–O'''. p-Value for hsFlp/Ay-GAL4. UAS-GFP, UAS-whd RNAi = 1.083×10⁻⁹ compared to control. Individual dots represent biological replicates. Values are mean ± SD, asterisks mark statistically significant differences (*p<0.05; **p<0.01; ***p<0.001, Student’s t-test). Scale bar: 20 µm n.s. = not significant.


