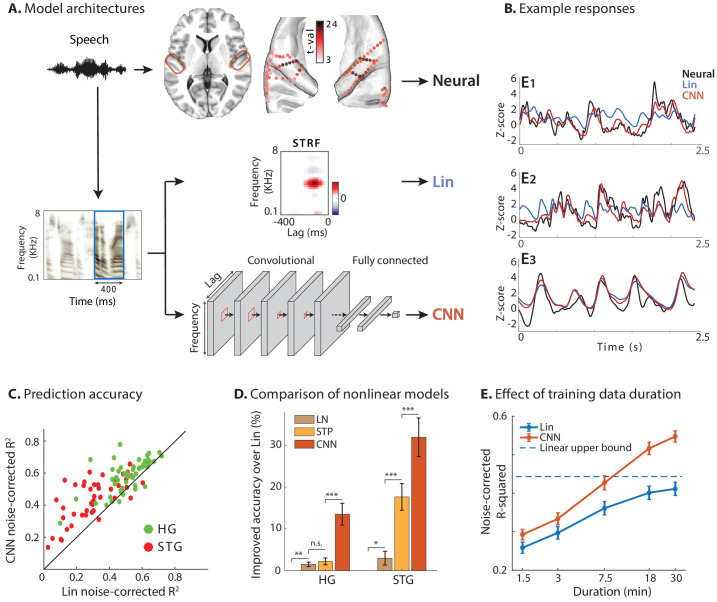
Figure 1. Predicting neural responses using linear and nonlinear regression models.
(A) Neural responses to speech were recorded invasively from neurosurgical patients as they listened to speech. The brain plot shows electrode locations and t-value of the difference between the average response of a neural site to speech versus silence. The neural responses are predicted from the stimulus using a linear spectrotemporal receptive field model (Lin) and a nonlinear convolutional neural network model (CNN). Input to both models is a sliding time-frequency window with 400 ms duration. (B) Actual and predicted responses of three example sites using the Lin and CNN models. (C) Prediction accuracy of neural responses from the Lin and CNN models for sites in STG and HG. (D) Improved prediction accuracy over Lin model for linear-nonlinear (LN), short-term plasticity (STP), and CNN models. (E) Dependence of prediction accuracy on the duration of training data. Circles show average across electrodes and bars indicate standard error. The dashed line is the upper bound of average prediction accuracy for the Lin model across electrodes. The x-axis is in logarithmic scale.


