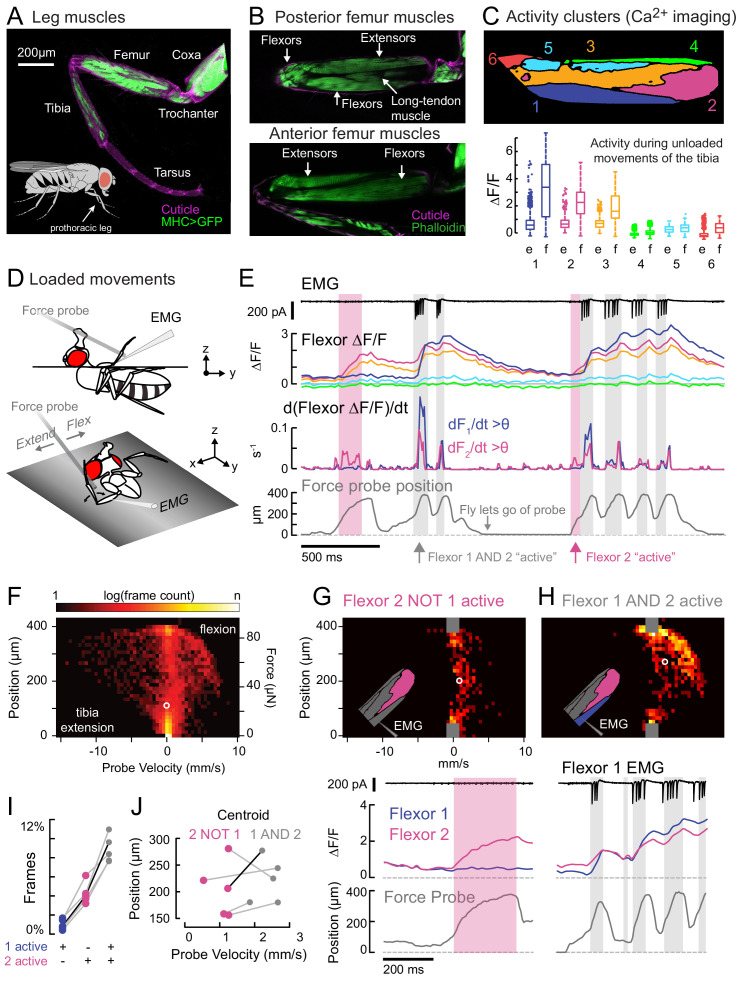
Figure 1. Functional organization and recruitment order among muscles controlling the Drosophila leg.
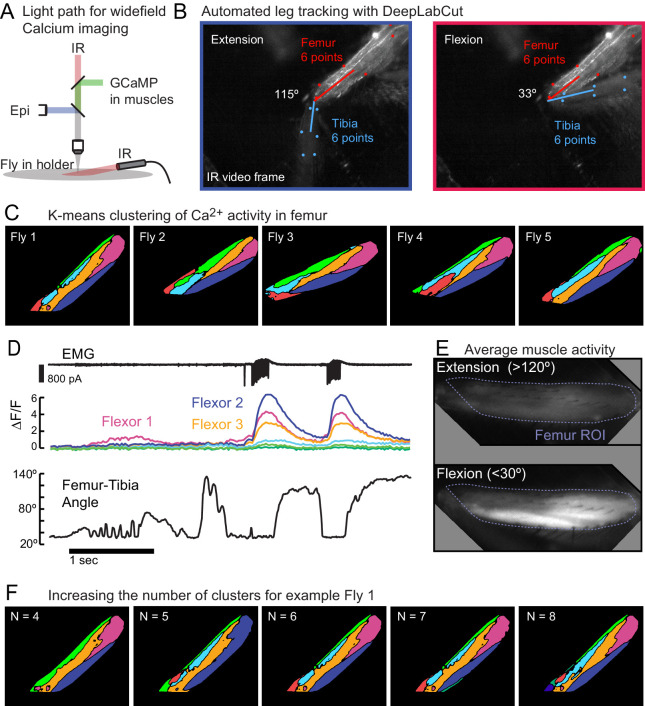
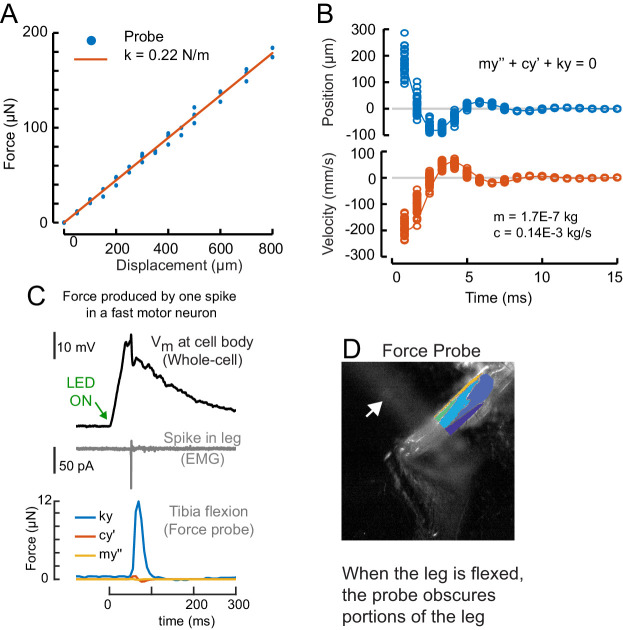
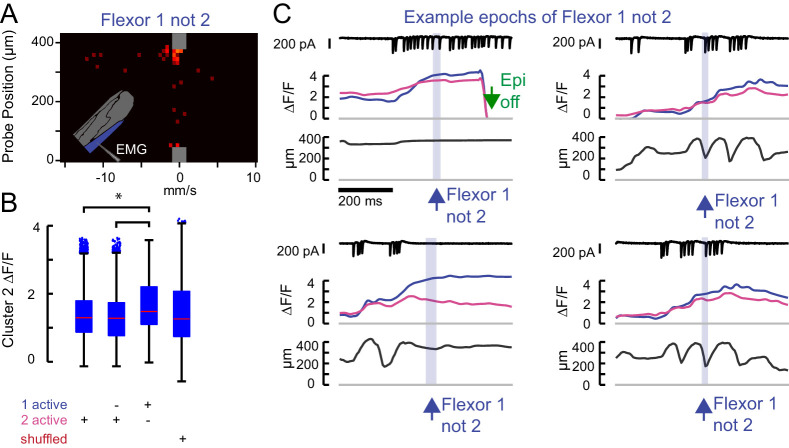
(A) Muscles of the right prothoracic leg of a female Drosophila (MHC-LexA; 20XLexAop-GFP). (B) Muscles controlling tibia movement in the fly femur. Top and bottom are confocal sections through the femur. Anterior-posterior axis refers to the leg in a standing posture (Soler et al., 2004). (C) Top: K-means clustering of calcium signals (MHC-Gal4;UAS-GCaMP6f) based on correlation of pixel intensities during 180 s of self-generated leg movements in an example fly (unloaded waving, see methods). Bottom: average change in fluorescence for each cluster, in each frame, when the leg is extended (femur-tibia joint >120°, 20772 frames) vs. flexed (<30°, 61,860 frames), n = 5 flies. Flexion activity was consistently higher (p=0.01 for cluster 5, p<10−6 for all other clusters, 2-way ANOVA, Tukey-Kramer correction). (D) Schematic of the experimental setup. The fly is fixed in a holder so that it can pull on a calibrated force probe with the tibia while calcium signals are recorded from muscles in the femur. (E) Calcium activity in tibia muscles while the fly pulls on the force probe (bottom trace). Cluster six was obscured by the probe and not included. The middle row shows the smoothed, rectified derivative of the cluster fluorescence (dFi/dt) for the two brightest clusters (1 and 2), which we refer to as Flexors. Highlighted periods indicate that both Flexors 1 and 2 are active simultaneously (gray, dF/dt > 0.005), or that Flexor 2 alone is active (magenta). (F) 2D histogram of probe position and velocity, for all frames (n = 13,504) for a representative fly. The probe was often stationary (velocity = 0), either because the fly let go of the probe (F = 0), or because the fly pulled the probe as far as it could (F ~ 85 µN), reflected by the hotspots in the 2D histogram. In F–H), the white circles indicate the centroids of the distributions. (G) Top - 2D histogram of probe position vs. velocity when Flexor 2 fluorescence increased, but not Flexor 1 (n = 637 frames, same fly as F). Gray squares indicate hotspots in F), which are excluded here. Color scaled to log(50 frames). Bottom – example of instance in which Flexor 2 alone is active (magenta shading). (H) Top - Same as G), when Flexor 1 AND 2 fluorescence increased simultaneously (n = 1449 frames). Bottom – gray shading indicates instances of activity in both Flexors 1 and 2. (I) Fraction of total frames for each fly in which both Flexor 1 and 2 fluorescence increased (gray), Flexor 2 alone increased (magenta), or Flexor 1 alone increased. Number of frames for each of five flies: 32,916, 13,504, 37,136, 37,136, 24,476. (J) Shift in the centroid of the 2D histogram when Flexor 1 fluorescence is increasing along with Flexor 2 fluorescence (gray), compared to when Flexor 2 fluorescence alone is increasing (p<0.01, Wilcoxon rank sum test). Black line indicates example cell in G) and H).


