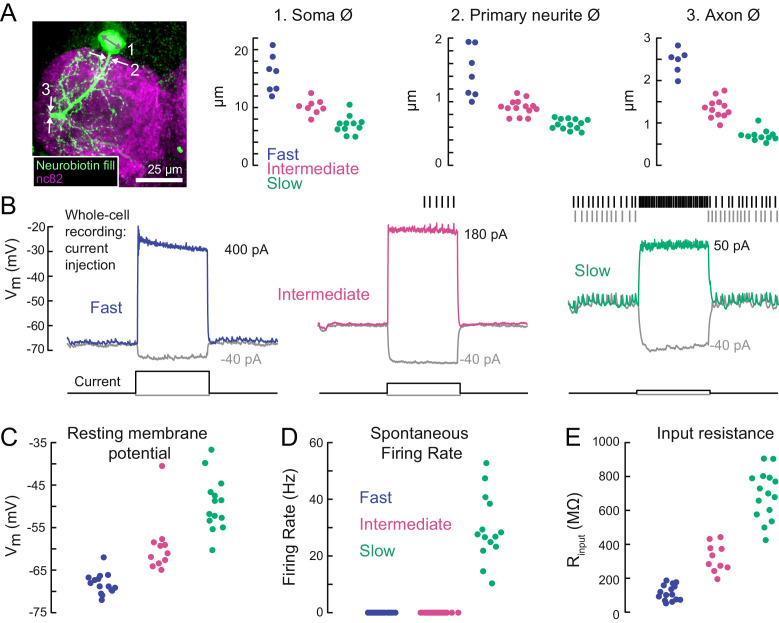
Figure 3. A gradient of intrinsic properties among tibia flexor motor neurons.
(A) Left) Maximum intensity projection of a Neurobiotin fill (green) of the fast tibia flexor motor neuron, with nc82 counterstain. Right) Diameters of identified neuron 1) somas, 2) primary neurites, and 3) axons (p<0.01, 2-way ANOVA, Tukey-Kramer correction for multiple comparisons). (B) Example traces showing voltage responses to current injection in whole-cell recordings from each motor neuron type. (C) Average resting membrane potential for fast (n = 15), intermediate (n = 11), and slow tibia flexor motor neurons (n = 14) (p<0.001, 2-way ANOVA, Tukey-Kramer correction for multiple comparisons). (D) Average spontaneous firing rate in fast (n = 15), intermediate (n = 11), and slow neurons (n = 14) (p<10−5). (E) Input resistance in fast (n = 15), intermediate (n = 11), and slow neurons (n = 14) (p<0.001, 2-way ANOVA, Tukey-Kramer correction for multiple comparisons). All intrinsic properties in C-E) were calculated from periods when the fly was not moving.

