. 2020 Jun 3;9:e56754. doi: 10.7554/eLife.56754

Figure 4. A gradient of force production among tibia flexor motor neurons.

(A) Optogenetic activation of a fast flexor motor neuron expressing CsChrimson (50 ms flash from a 625 nm LED,~2 mW/mm2). Traces show average membrane potential for trials with one (top) and two (bottom) spikes, the average EMG (top) or overlaid EMGs (bottom), and the resulting tibia movement for each trial (50 µm = 11 µN). The jitter in the force probe movement traces results from variability of when a spike occurs relative to the video exposure (170 fps). (B) Same as A for an example intermediate flexor motor neuron. (C) Tibia movement resulting from current injection in a slow flexor motor neuron. Top: spike rasters from an example cell during current injection. Firing rates are shown below, color coded according to current injection value, followed by the baseline subtracted average movement of the probe (5 µm = 1.1 µN). Bottom: spike rates and probe movement in the presence of the cholinergic antagonist MLA (1 µM), which reduces excitatory synaptic input to the motor neuron. (D) Peak average force vs. number of spikes for fast (blue), intermediate (magenta), and slow (green) motor neurons. The number of spikes in slow neurons is computed as the average number of spikes during positive current injection steps minus the baseline firing rate; that is, the number of additional spikes above baseline. The black line is a linear fit to the slow motor neuron data points, with the slope indicated below. (E) Peak probe displacement for 2 spikes vs. one spike in fast (blue) and intermediate motor neurons (magenta). (F) Summary data showing that zero spikes in fast (n = 7) and intermediate neurons (n = 6) does not cause probe movement, but that hyperpolarization in slow motor neurons (n = 9) causes the fly to let go of the probe, that is, decreases the applied force. The number of spikes (x-axis) is computed as the average number of spikes per trial during the hyperpolarization.(G) Delay between a spike in the cell body and the EMG spike (conduction delay). Note there may be a delay from the spike initiation zone to the cell body that is not captured (n = 5 intermediate cells), p=0.6, Wilcoxon rank sum test. (H) Time to half maximal probe displacement for fast (blue) and intermediate cells (magenta), p=0.2, rank sum test. (I) Estimates of the maximum velocity of tibia movement in each fast (blue) and intermediate motor neuron (magenta), p=0.0012, rank sum test. A line was fit to the rising phase of probe points aligned to single spikes as in B) and D).

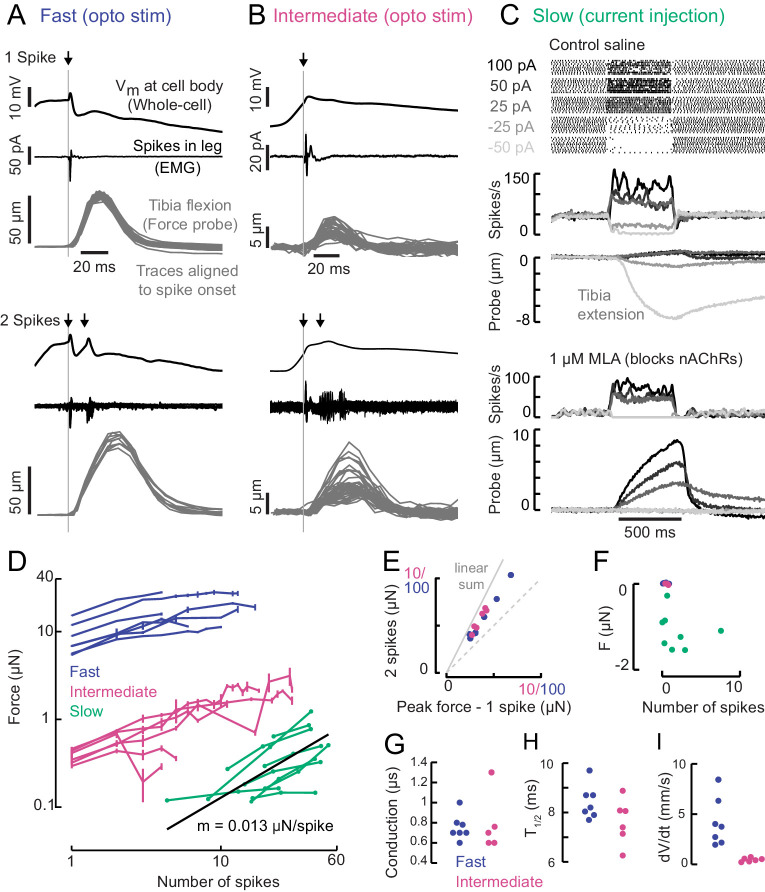
Figure 4.

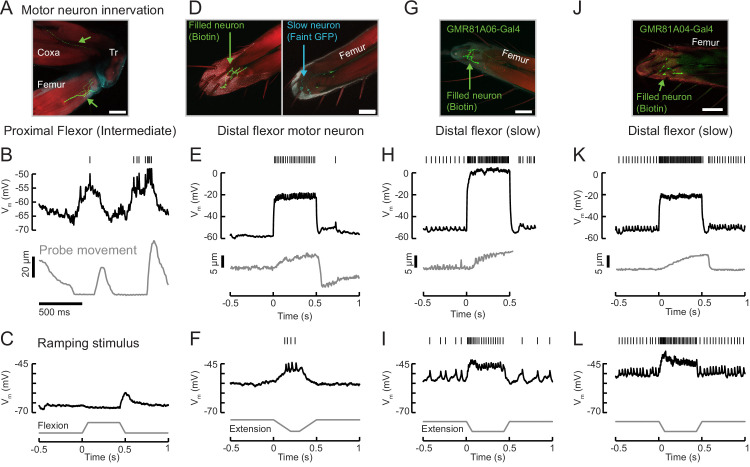
Figure 4—figure supplement 1. Example recordings from other tibia flexor neurons.

Figure 4—figure supplement 1.

(A) Confocal image of an intermediate flexor motor neuron axon (neurobiotin fill is shown in green; red is phalloidin) from UAS-GFP;R81A06-Gal4. The filled neuron targets the proximal femur. Scale bar is 50 µm. The axon appears to target different fibers than the intermediate neuron in R22A08-Gal4. (B) Membrane potential, spikes, and probe movement during spontaneous movements. Membrane potential reflects and slightly precedes flexion events, and spikes occur at low forces. (C) Single trial example of sensory feedback. The neuron rests at −67 mV. Passive flexion of the leg (60 μm = 8°) hyperpolarizes the intermediate neuron in R81A06-Gal4. Extension causes an 8 mV EPSP. Compare to Figure 6. (D) Confocal image of a flexor motor neuron axon in the leg, neurobiotin fill is shown in green; red is phalloidin. The recording was from an unidentified, non-GFP-expressing neuron in a UAS-GFP;R35C09-Gal4 fly. The GFP-expressing slow motor neuron is seen in cyan in the right image, at a different z position. The filled neuron targets fibers more proximal than the slow motor neuron. (E) This neuron rested at −55 mV and did not spike at rest. Current injection could evoke spikes, and moderate spike rates caused steady state tension similar in magnitude to a single intermediate neuron spike (~5 um displacement of the probe). Interestingly, the resulting load on the force probe was sufficient to rapidly force the leg into an extended position. This in turn caused a depolarization and spike in the motor neuron, as the fly returned the probe to the resting position by placing more force on the probe. (F) Single trial example of sensory feedback. A slow extension of the leg (60 μm = 8°) depolarized the neuron and drove spikes. (G) Confocal image of a flexor motor neuron axon from UAS-GFP;R81A06-Gal4. The filled neuron appears to have a more extensive axon terminal than the slow motor neuron labeled by R35C09-Gal4. (H) This neuron rested around −53 mV, with a spontaneous spike rate of 12 Hz. Large increases in spike rate increased the force on the probe. The recording ended prematurely and we did not capture the probe returning to rest, but note the depolarization and small increase in the spike rate following the end of the current injection, similar to the neuron in panels D-F). Noise in probe position is due to poor lighting and is not time locked to spikes. (I) Single trial example of sensory feedback. Extension of the leg (60 μm = 8°) of the probe depolarized the neuron and drove spikes. (J) Confocal image of a flexor motor neuron axon from UAS-GFP;R81A04-Gal4. (K) This neuron rested around −51 mV, with a spontaneous spike rate of 28 Hz, an input resistance of 486 MΩ, and could increase flexion force more than the slow neuron labeled by R35C09-Gal4. (L) Single trial example of sensory feedback. Extension of the leg (60 μm = 8°) of the probe depolarized the neuron and drove spikes.