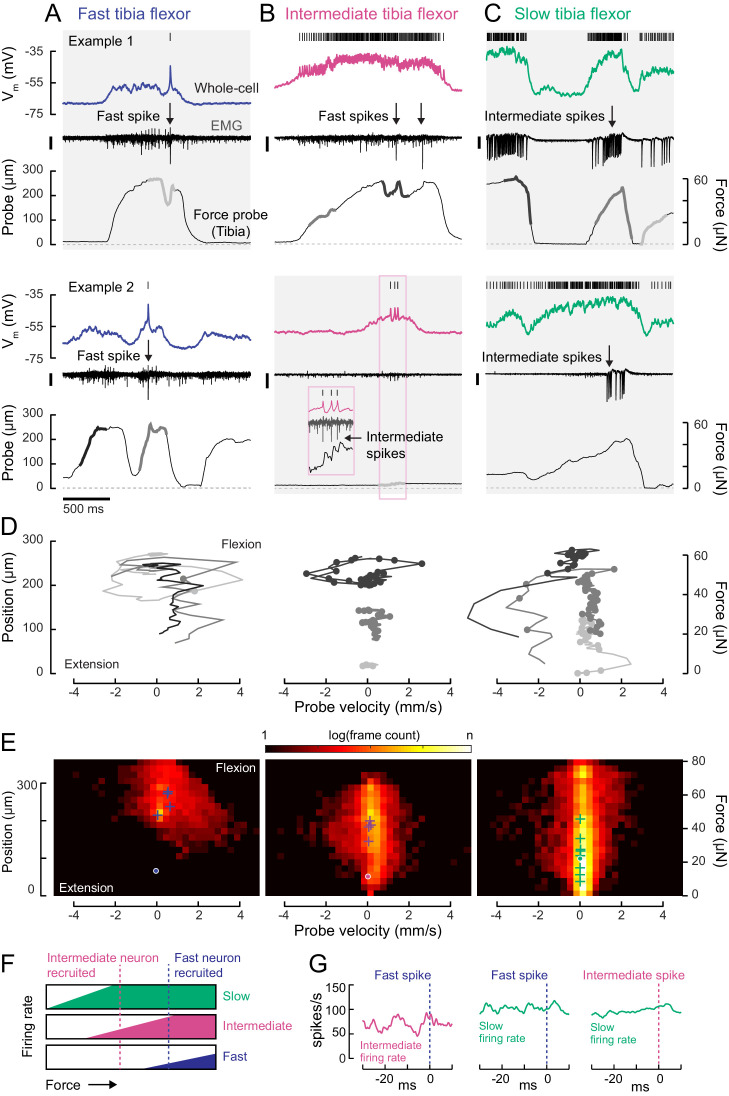
Figure 5. Motor neurons are recruited in a specific order across different motor regimes.
(A) Membrane potential, EMG, and probe movement, for two example epochs of spontaneous leg movement during a whole-cell recording of the fast motor neuron. Highlighted events are plotted in D. The EMG was recorded in the proximal femur to pick up both fast and intermediate spikes (scale is 10 pA). (B) Same as A, but for an intermediate motor neuron. The EMG for the intermediate neuron was recorded in the proximal part of the femur, the largest events reflect activity in the fast motor neuron (scale is 100 pA). (C) Same as A-B, but for a slow motor neuron. The EMG was recorded in the proximal femur, near the terminal bristle, and large events are likely from the intermediate neuron (scale is 100 pA). (D) Example force probe trajectories from movement examples. The grayscale in D matches that of the trajectories in A-C. Each vertex is a single frame; vertices with dots indicate the occurrence of a spike in the whole-cell recording. (E) 2D histograms of probe force and velocity for video frames within 25 ms following a spike across recordings in cells of each type (fast – five neurons, 4666 frames; intermediate – four neurons, 11,833 frames; slow – nine neurons, 65,473 frames). Crosses indicate the centroids of the histograms for individual neurons. Dots outlined in white indicate centroid of the 2D histograms of all frames, within and outside the 25 ms window. Color scale shows the log number of frames in each bin, normalized to the total number of frames. (F) Schematic illustrating firing rate predictions of the recruitment hierarchy. As force increases, left to right, first the slow neuron begins firing, then the intermediate neuron (magenta line). Once the fast neuron spikes, both intermediate and slow neurons are already firing (blue dotted line). (G) Left) Spike rate of intermediate neuron in 30 ms preceding fast EMG spike (n = 4 pairs); center) slow neuron spike rate preceding fast EMG spike (n = 2 pairs); right) and slow neuron spike rate preceding intermediate EMG spike (n = 3 pairs).


