. 2020 Jun 3;9:e56754. doi: 10.7554/eLife.56754

Figure 6. A gradient of proprioceptive feedback to motor neurons controlling tibia flexion.

(A) Whole-cell recordings of fast, intermediate, and slow motor neurons in response to flexion (black) and extension (gray) of the tibia. Each trace shows the average membrane potential of a single neuron (n = 7 trials). A 60 μm movement of the probe resulted in an 8° change in femur-tibia angle. (B) Spike rasters and firing rates for the same slow neuron as in A. (C) Amplitude of the postsynaptic potential (PSP) vs. angular velocity of the femur-tibia angle (n = 7 fast, seven intermediate, nine slow cells). Responses to fast extension (−123°/s) are not significantly different for fast and intermediate neurons (p=0.5) but are different for slow neurons (p<10−5, 2-way ANOVA, Tukey-Kramer correction for multiple comparisons). (D) Amplitude of firing rate changes in slow motor neurons vs. angular velocity of the femur-tibia angle. (E) Time-course of normalized average responses (± s.e.m. of baseline subtracted responses) to tibia extension (left) and flexion (right, n = 7 fast, seven intermediate, nine slow cells). (F) Sensitivity of firing rate to small tibia movements of 6 μm (0.8°) or 18 μm (2.4°). Spike rasters are from representative cells, the average spike rate across cells is plotted in green below.

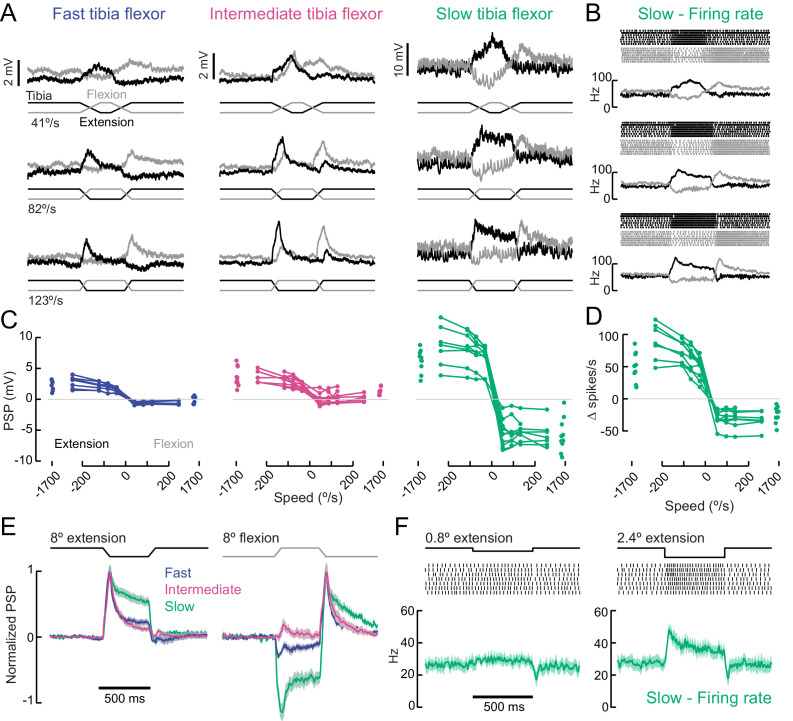
Figure 6.

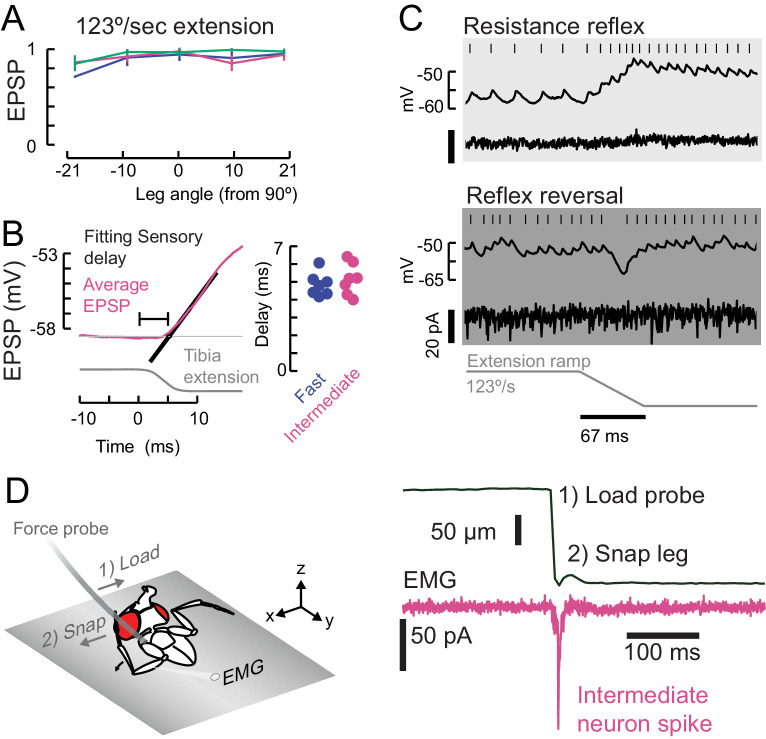
Figure 6—figure supplement 1. Properties of sensory feedback to motor neurons.

Figure 6—figure supplement 1.

(A) The EPSP evoked by fast ramping extension stimuli did not significantly depend on leg angle. (B) We measured the onset of the sensory evoked EPSP (magenta, intermediate neuron) in the motor neurons by fitting a line (black) to the rising phase of the average response. We measured the time from the start of the command to the piezoelectric actuator for the largest step stimulus (8° extension, shown here as reference). Sensory delays in the fast and intermediate neurons were similar. We did not measure the sensory delays in slow neurons because 1) the spike rate was calculated with an acausal smoothing filter and 2) the average EPSPs were not smooth because of the presence of spikes. (C) An example of reflex reversal in a slow motor neuron. Top) A normal resistance reflex in which an extension of the leg depolarizes the membrane potential and increases the spike rate. Bottom) When the fly was pulling on the force probe and the EMG activity was increased, the extension stimulus instead hyperpolarized the neuron. (D) To test faster stimuli than we could deliver with a piezoelectric actuator, we pulled on the probe with a hook until the hook lost contact, and the probe snapped back to rest. We identified intermediate EMG spikes using optogenetic excitation of R22A08-Gal4 motor neurons. This ballistic stimulus was able to evoke intermediate neuron spikes, but not fast neuron spikes (not shown).
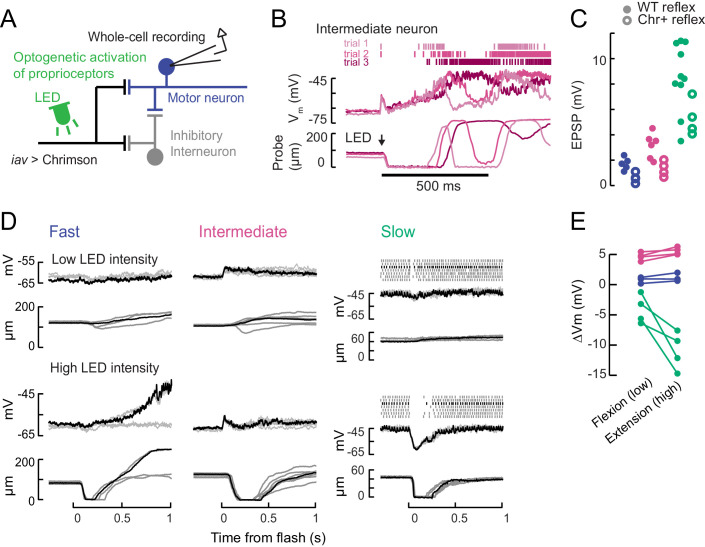
Figure 6—figure supplement 2. Optogenetic activation of proprioceptive sensorimotor circuits.

Figure 6—figure supplement 2.

(A) Optogenetic activation of proprioceptive feedback to tibia motor neurons. The axons of femoral chordotonal neurons, labeled by iav-LexA, were stimulated with Chrimson activation during whole-cell recordings. (B) Example responses in an intermediate neuron to a high intensity 10 ms light flash that drove activity in chordotonal neurons expressing Chrimson (iav-LexA >Chrimson). The membrane potential and spikes from three trials are shown above (magenta shading) and the simultaneous force probe movement is shown below. Like the flicking stimulus in Figure 5—figure supplement 1, this large stimulus drove intermediate neurons, but not fast neurons, to spike. The effect of the light stimulus was surprisingly long-lasting, producing membrane potential fluctuations and movements over ~200 ms. (C) Expression of Chrimson decreases gain of proprioceptive feedback. Peak of the average EPSP in fast (blue), intermediate (magenta), and slow (green) motor neurons in response to a ramping extension stimulus (123 °/s), in flies that either express Chrimson in FeCO neurons (Chr+ reflex, empty circles) or not (WT reflex, filled circles). Chrimson expression reduces EPSPs, p<0.01 for all neurons, Wilcoxon rank-sum test. (D) Example recordings showing membrane potential, spiking activity, and probe position following an LED flash. Top: low intensity flashes caused the fly to mainly pull on the force probe, from individual fast (5.5 mW/mm2), intermediate (4.8 mW/mm2), and slow neurons (1.3 mW/mm2). Each trace is a single trial; the black traces belong to the same trial. Bottom: higher LED intensities caused the fly to let go of the force probe in fast (10.9 mW/mm2), intermediate (7.8 mW/mm2), and slow neurons (6.3 mW/mm2). (E) Summary of optogenetically-evoked membrane potential changes in motor neurons for low (flexion-producing) and high (extension-producing) LED intensities. Fast and intermediate neurons depolarized initially, so the amplitude of the depolarization is quantified. Slow motor neurons exhibited stronger hyperpolarization.